All indicators

Parallel Pivot Lines

By LuxAlgoMar 24, 2021

Static chart image

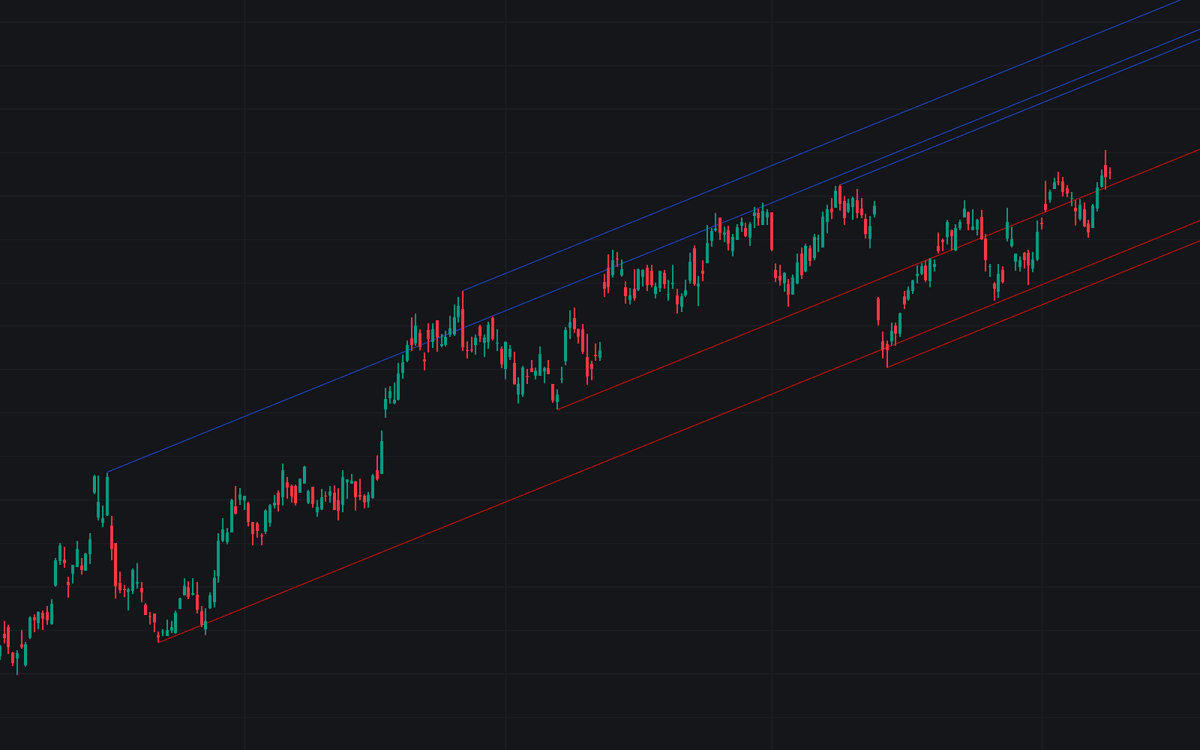
This innovative trading indicator displays lines connecting past pivot high/low points, with each line adopting the slope of a linear regression. Users have control over the slope through the 'Slope' setting, enabling the lines to serve as potential support or resistance levels.

Customizable Settings for Optimal Trading

  • Length: Adjust the pivot length to determine how many significant pivot points the lines connect to. Opt for higher values to capture more substantial pivot points.
  • Lookback: Choose the number of lines connecting a pivot high/low you wish to display. The total number of lines is determined by Lookback multiplied by 2.
  • Slope: Modify the slope of the linear regression lines by choosing a number between -1 and 1, offering flexibility in line orientation.

Considerations When Using the Indicator

This indicator comes with several real-time limitations. Lines are rendered based on historical data and do not update dynamically with the emergence of new bars. To realign the indicator with recent pivots, you will need to either temporarily hide/unhide the indicator or modify its settings. If you select high Length or Lookback values, it's possible no lines will render if pivot points fall outside the defined buffer zone of 5000 bars.

Practical Application: Using the Trading Indicator for Support and Resistance

This tool isn't just an indicator; it functions more akin to a drawing tool for establishing fixed supports and resistances due to its non-updating nature. This unique characteristic makes it advantageous for traders seeking stable support/resistance lines.

By manipulating the Slope setting, users can direct the angle and direction of the lines. Setting a Slope of 1 replicates the slope of a linear regression line spanning from the outermost displayed pivot point to the current bar, allowing for strategic resistance and support plotting.

indicator image

As illustrated above, the indicator can provide vital insights alongside linear regression displayed in orange.

indicator image

For horizontal lines, set the Slope to 0, anchoring supports/resistances solidly across the chart.

indicator image

Employing a negative slope lets users draw lines that move against the primary trend, adding a layer of nuanced technical analysis.

Maximizing Your Trading Strategy with This Drawing Tool

This indicator is perfect for traders aiming for a novel approach to drawing supports and resistances. It offers a unique way to map out the market's movements effectively. Explore its potential and incorporate it into your trading strategy to enhance your market engagement.

FAQ Section

How can I access this indicator? You can access it on the LuxAlgo Library for charting platforms like TradingView, MetaTrader (MT4/MT5), and NinjaTrader for free.

Is the slope adjustable in real-time? No, slopes are adjusted manually through settings and do not update automatically with new data.

Can this indicator be used for all market types? Yes, it is versatile for different market types, but especially useful for those seeking long-term support and resistance levels.

This approach to drawing and understanding pivot-based support and resistance can significantly bolster your trading toolkit.

Free indicator

Get free access to this indicator on the platforms below.

TradingView
NinjaTrader
MetaTrader 4/5
Original indicatorBuilt in-house by LuxAlgo

The Library is free. Quant makes it yours.

Pull any concept or indicator into Quant: rebuild it, retune it, or turn it into a backtested strategy of your own.