Concept
Parallel Channel
Parallel Channel is a Trend concept. The Library holds 3 implementations, each one a working definition you can pull into Quant.
Top Parallel Channel indicators
The top custom implementations, built on the original standard Parallel Channel formula.
3 total
Every Parallel Channel implementation here is strategy-ready: open one in Quant, set your rules, and it backtests automatically.
.png&w=3840&q=75)
What is a Parallel Channel?
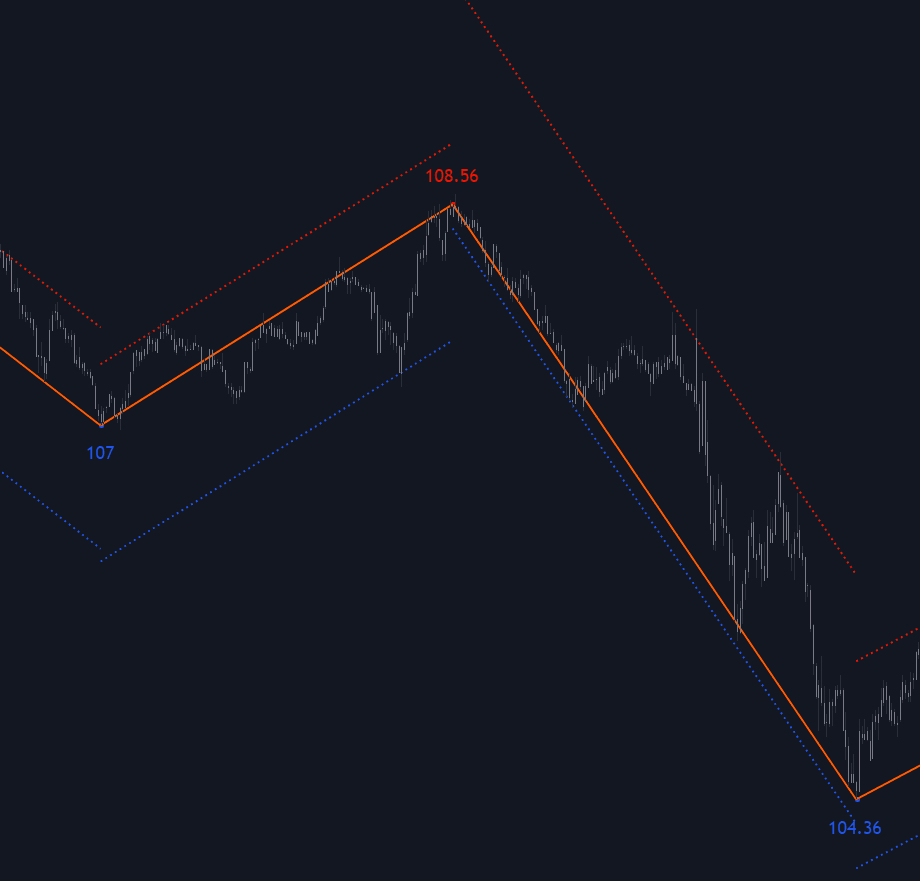
A parallel channel (or equidistant channel) is two same-slope lines containing a trend: a trendline drawn along the swing lows and a parallel copy along the swing highs for a rising channel, the mirror image for a falling one, and a horizontal pair, which is simply a rectangle, for a range. Classical charting calls the outer line the return line: the trend advances along one boundary and returns to the other, so the pattern describes a market oscillating regularly around a persistent slope.
The construction is among the oldest in classical charting. Edwards and Magee's Technical Analysis of Stock Trends (1948), the manual that descends from Richard Schabacker's 1930s work, fixed the vocabulary chartists still use, including the return line for the outer boundary. The idea has since been rebuilt many times: Andrews' pitchfork hangs the parallels from a three-pivot median line, regression channels fit the corridor by least squares, and band studies such as the MA envelope wrap a moving average in parallel offsets, trading the chartist's chosen pivots for a rule or a formula.
The channel supports two opposite trades and one warning. While it holds, the boundaries act as a corridor: entries near the base trendline in trend direction, exits or fades near the return line. When it fails, a decisive close outside either boundary is the channel's breakout: downward through a rising channel's base it breaks the trend and warns of reversal, upward through its return line it signals acceleration. The warning is the shortfall: swings that stop reaching the return line are conventionally read as fading momentum, a caution rather than a verdict, since channels drift and get redrawn as trends mature.
A channel is also a statement about trend quality. Its slope is the trend's gradient; its width is the rhythm of pullbacks, the corridor within which a trend-following tool such as Supertrend or a rising EMA keeps its holder comfortable. Because the lines come from chosen pivots, two competent analysts can draw different channels on the same trend, which is the pattern's honest weakness; pivot-based indicators that draw channels mechanically remove the discretion at the cost of some judgment about which swings matter.
How to draw a parallel channel
The drawing rules are the trendline's, plus one clone:
- 1Draw the base trendline through at least two swing lows in an uptrend (swing highs in a downtrend), the side the trend keeps defending.
- 2Clone it through the most prominent intervening swing extreme on the opposite side, keeping the slope identical.
- 3Check containment: the more alternating touches both lines collect without meaningful violation, the more established the channel; fit to the obvious pivots rather than forcing every wick inside.
- 4Track behavior, not just geometry: alternating touches confirm it, mid-channel stalls warn, and a decisive close outside it retires the drawing.
How it's calculated
Two lines with the same slope that bound trending price action: a base trendline plus a parallel copy shifted to an opposite extreme.
Both lines share slope m by construction; w is positive in a rising channel drawn from lows and negative in a falling channel drawn from highs.
The linear regression channel is the statistical variant: slope from a least-squares fit and width from a multiple of the standard deviation or the maximum deviation of price around the fit.
On log-scale charts compute the slope on log prices so the lines remain parallel visually.
How traders use it
- As a corridor framework: buy the base line, take profit into the return line (reversed in downtrends), with stops placed just beyond the defended boundary.
- As a breakout map: closes beyond a boundary flag trend change or acceleration, usually traded on a retest of the broken line because wick-throughs and false breakouts are common around obvious channels.
- As a projection tool: the channel's width, projected from the break point, gives the classical measure-rule objective after a breakout.
- As a momentum read: whether swings reach, exceed, or undershoot the return line grades trend health while the pattern lasts.
- As a with-trend filter: corridor entries are taken only on the side agreeing with a higher-degree gauge, whether a rising SMA, a trend regime label, or the slope of the channel itself.
Parallel Channel vs computed alternatives
MA Envelope: An envelope offsets a moving average by a fixed percentage, so its corridor curves with the average and updates every bar. A parallel channel is straight lines through chosen swing pivots: static geometry, but anchored to extremes traders actually defended.
Dynamic S/R via MA: A moving average used as support or resistance adapts every bar, so violations register as crossings of a curve rather than breaks of fixed geometry. A channel boundary is a static line whose decisive violation is itself the signal, which makes invalidation easier to define.
Supertrend: Supertrend trails one ATR-based line on one side of price and flips on a break, labeling regime rather than drawing a corridor. A channel keeps both boundaries live, supporting fades at the return line that a one-sided trailing stop never proposes.
Concept family
Trend
100 concepts mapped · 100 in the Library
Parallel Channel FAQ
Turn Parallel Channel into a trading strategy.
Take any implementation from this page into Quant, then build on it, backtest it on real data, and keep refining it in conversation.