Concept
Trendline
Trendline, also known as trendline break, internal trendline, is a Trend concept. The Library holds 10 implementations, each one a working definition you can pull into Quant.
manual/auto-detected
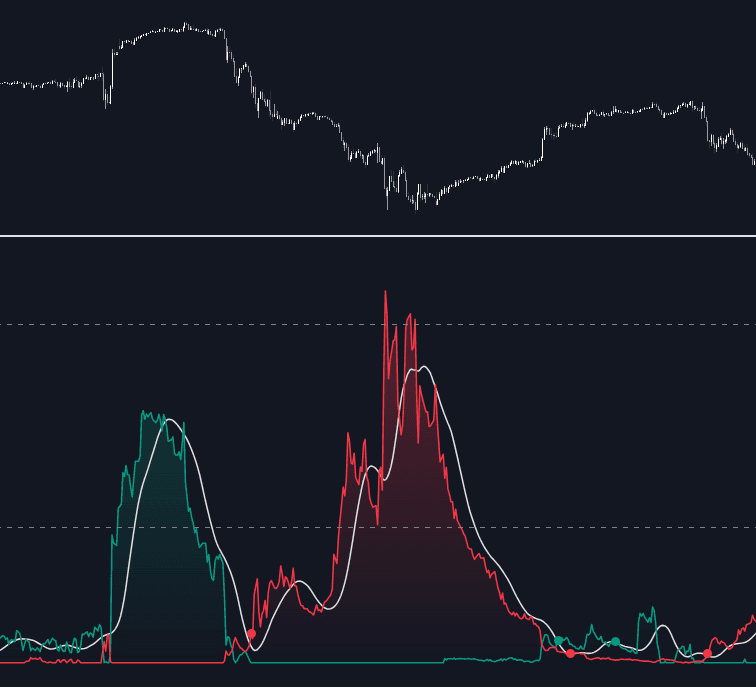
Top Trendline indicators
The top custom implementations, built on the original standard Trendline formula.
10 total
Every Trendline implementation here is strategy-ready: open one in Quant, set your rules, and it backtests automatically.
.png&w=3840&q=75)
What is a Trendline?
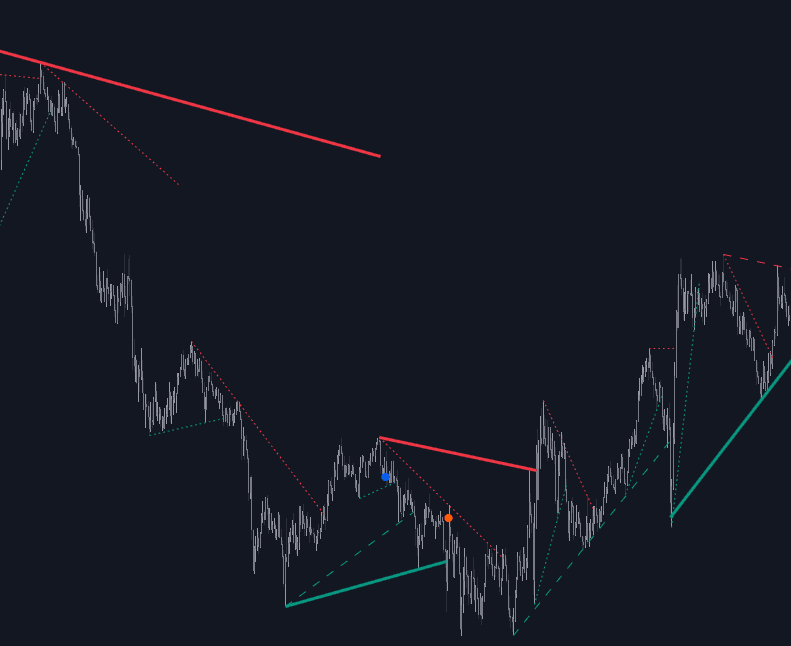
A trendline is a straight line drawn across successive swing points and projected forward: under rising lows to mark diagonal support in an uptrend, over falling highs to mark diagonal resistance in a downtrend. Two touches define the line; by common convention a third touch validates it. Once in place it does two jobs at once: its slope states how fast the trend is running, and its line marks where that pace is being defended.
Drawing rules are genuinely contested, so most sources present conventions rather than laws. Some connect wicks, others closes or candle bodies; 'internal' trendlines deliberately cut through a few extremes to fit the bulk of price action. On higher timeframes the chart scale matters too, since a line that is straight on a linear chart curves on a logarithmic one. Automated detection sidesteps the subjectivity by fitting lines through ZigZag or fractal pivots and flagging breaks mechanically.
Trendlines matter because they encode the trend's rate, not just its direction, and a broken line is often the earliest warning that the rate has changed, well before horizontal levels give way. The hedge is equally important: steep lines break routinely while the trend survives at a shallower angle, and two people rarely draw the same chart identically. A trendline break is information about pace, not by itself a reversal signal.
How to draw a trendline
The steps are simple; the discipline is in keeping your drawing rules consistent from chart to chart.
- 1Locate at least two clear swing points moving in the same direction: higher swing lows for an up trendline, lower swing highs for a down trendline. Prominent pivots beat minor wiggles.
- 2Connect them and extend the line to the right. Decide up front whether you draw on wicks, closes, or bodies and keep that choice fixed; on weekly and monthly charts, check the line on log scale.
- 3Wait for a third touch before treating the line as validated. More touches at spaced intervals mean the market has repeatedly defended that pace, and likely that more stops have accumulated behind the line.
- 4Judge breaks by closes, not pokes: a decisive close through the line, with follow-through or a retest from the far side, carries far more weight than a single intrabar violation.
How traders use it
- Trend participation: buying tests of a rising trendline (or shorting tests of a falling one) with a stop beyond the line, using the diagonal the way horizontal traders use a level.
- Break alerts and exit triggers: a close through a mature trendline is an early caution that the trend's pace has changed, commonly used to tighten stops, take partial profits, or arm a breakout entry in the new direction.
- Pattern construction: triangles, wedges, flags, and channels are all built from trendlines, and the measured objectives of those patterns inherit whatever drawing choices went into the lines.
- Automated trendline systems: algorithms fit lines through detected pivots, adjust slopes as swings evolve, and alert on breaks, trading human subjectivity for parameter sensitivity and the occasional line no human would draw.
Trendline vs. related concepts
Parallel Channel: A channel is a trendline plus a parallel copy projected on the other side of price, adding an opposite boundary for targets and overextension reads. A single trendline defines only one side of the move.
Linear-regression Channel: A regression channel is fitted through every bar by least squares, so it has a statistical midline and symmetric bands. A trendline touches only selected swing extremes and encodes a judgment about which pivots matter.
Fan Principle: The fan principle redraws successively flatter trendlines from the same anchor as steeper ones break. It exists precisely because a single trendline break so often means the trend slowed rather than ended.
Dynamic S/R Via MA: A moving average also provides sloped support and resistance, but it recalculates each bar and curves with price. A trendline's slope is fixed by the swings it was drawn on and changes only when redrawn.
More Trendline implementations
Concept family
Trend
100 concepts mapped · 100 in the Library
Trendline FAQ
Turn Trendline into a trading strategy.
Take any implementation from this page into Quant, then build on it, backtest it on real data, and keep refining it in conversation.