Pure Price Action Structures
By LuxAlgoJul 11, 2024

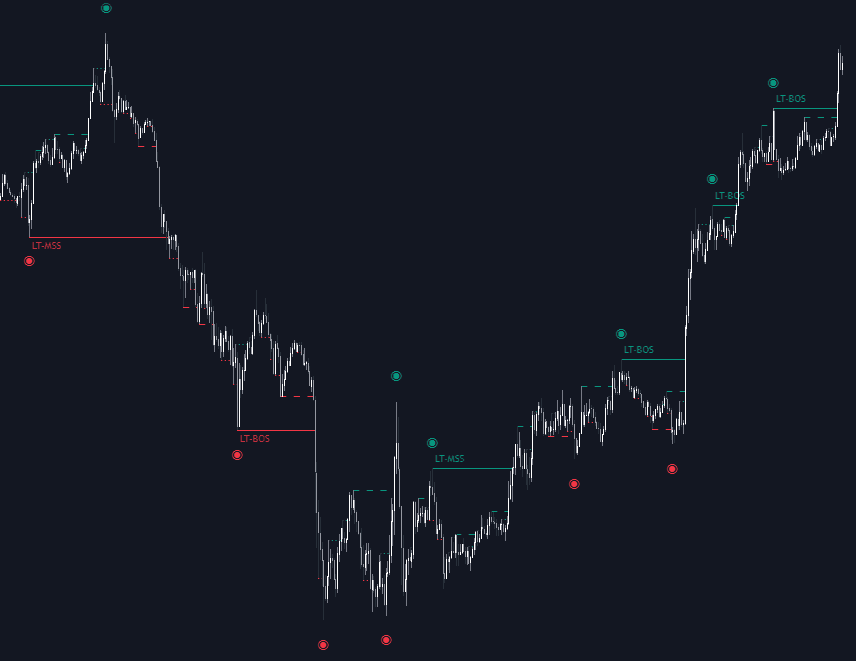
The Pure Price Action Structures indicator is a powerful tool for traders seeking to understand market dynamics through pure price action analysis. By utilizing this indicator, traders can automatically detect real-time market structures, crucial for identifying shifts and breaks in market trends.
Unlike many other indicators, the Pure Price Action Structures indicator relies solely on price patterns without any user-defined inputs. This unique feature ensures a robust, objective analysis of market dynamics and facilitates a better understanding of price movements for all types of traders.
How to Use the Pure Price Action Structures Indicator to Enhance Your Trading Strategy
Grasping market structure is essential for effective price action trading. This indicator streamlines the process by automatically detecting real-time market structures, aiding traders in understanding market trends and making well-informed trading decisions. With this tool, you can easily recognize both potential trend reversals and continuations.
Market structures are categorized into three sets of swing points: short-term, intermediate-term, and long-term swings. Each provides insights into the market, with longer-term swing points often highlighting broader trends. This categorization assists traders in aligning their strategies with market behavior.
A key feature within the indicator is the identification of market structure shifts (MSS), also known as changes of character (CHoCH). These highlight potential shifts in market sentiment. Conversely, a break of structure (BOS) often signals the continuation of the existing trend. However, using these signals, traders should account for the possibility of them indicating liquidity zones or consolidation areas before making trading decisions.
Understanding Market Structures
Detailed Market Structures Analysis
Market structures are a fundamental aspect of price action analysis, helping traders to identify key levels and patterns crucial for predicting market movements. The detection of swing points is at the heart of ICT trading methodologies and teachings, guiding traders on strategic decision-making.
Swing points, automatically detected based on market movements, are devoid of any external inputs, offering a precise analysis devoid of bias.
Effective Use of Swing Points in Trading
Though swing points, especially short-term ones, may not provide immediate real-time signals due to a slight detection delay, they are invaluable for trend analysis and entry/exit strategies. By evaluating historical data, traders can:
- Recognize Trends: Identifying higher or lower swing highs and lows, traders can determine market trends, essential for strategic planning.
- Identify Critical Levels: Swing highs act as resistance levels, while swing lows serve as support levels, guiding entry and exit strategies in alignment with ICT terminologies of Buyside and Sellside Liquidity Levels.
- Spot Reversal Indicators: By recognizing patterns such as double tops/bottoms or head and shoulders, traders can anticipate potential reversals.
- Strategize Risk Management: Swing levels help in setting stop loss and take profit points, ensuring trades are grounded in market realities, as they point to likely high-activity zones of buy or sell orders.
In essence, swing points provide traders with essential insights for improving their trading strategies, allowing for more calculated moves and better risk management.
Customizations and Settings: Tailor the Indicator to Fit Your Needs
Structures
- Swings and Size: Customize visibility and size of the icons representing swing highs and lows to fit personal preference.
- Market Structures: Control the visibility of the overall market structures for a cleaner or more detailed chart.
- Market Structure Labels: Utilize labels to clearly identify different market structures.
- Line Style and Width: Personalize the appearance of the structure lines to suit individual charting aesthetics.
- Swing and Line Colors: Adjust the color settings for highs, lows, and market structures to improve visually tracking trends.
Explore More with Related Scripts
Explore further with related scripts that can enhance your trading setups:
FAQ
What is the Pure Price Action Structures indicator? The Pure Price Action Structures indicator is a tool designed to identify market structures based solely on price action, allowing traders to recognize shifts and breaks in market trends effectively.
How does the indicator detect market structure shifts and breaks? The indicator uses real-time data to automatically identify swing highs and lows that indicate potential shifts in market sentiment and breaks in existing trends.
Can this indicator be modified using user-defined inputs? No, the indicator functions entirely on price patterns without user-defined inputs, ensuring a pure and unbiased analysis.
Where can I get access to the Pure Price Action Structures indicator? You can get access on the LuxAlgo Library for charting platforms like TradingView, MetaTrader (MT4/MT5), and NinjaTrader for free.
Free indicator
Get free access to this indicator on the platforms below.
Unlock the entire LuxAlgo Library
Every indicator, every strategy, full charts, and complete access to Quant — our AI agent.