Rolling Liquidity Clusters Channel
By LuxAlgoFeb 18, 2026
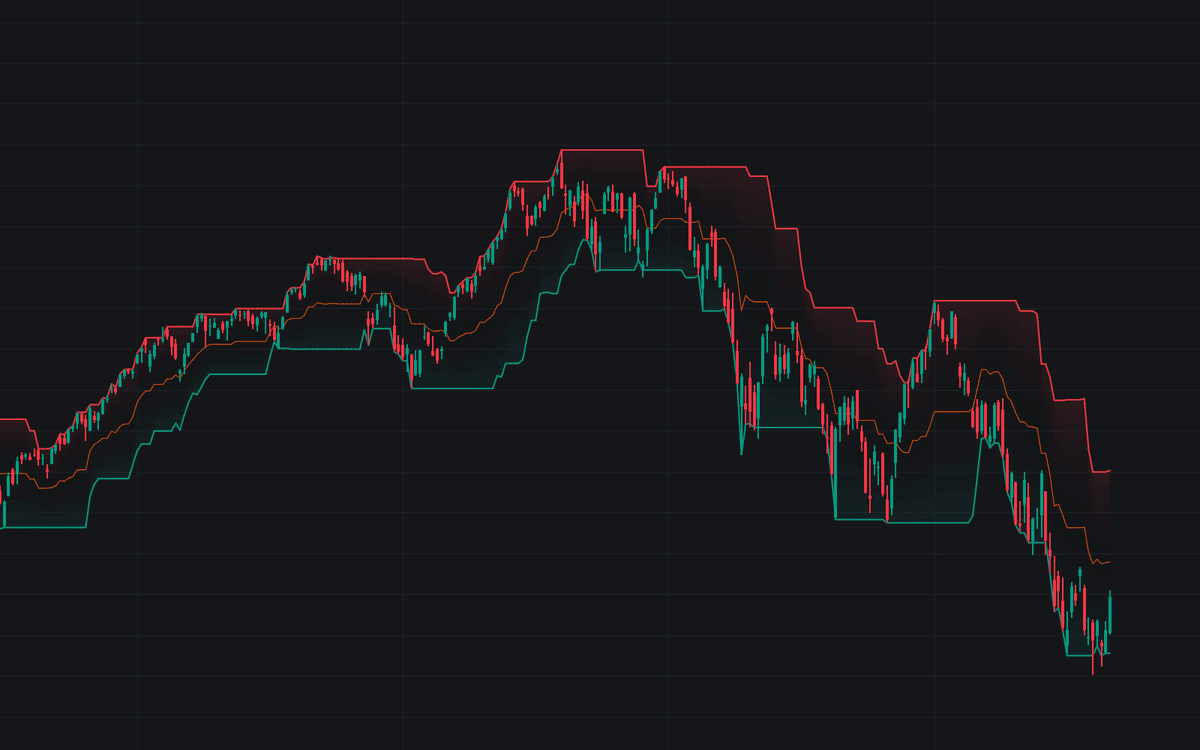
The Rolling Liquidity Clusters Channel is a trading indicator that maps dynamic support and resistance by finding the most “respected” price levels inside a rolling window—where wicks repeatedly reject a level, while candle bodies never close through it. The result is a clean liquidity-based channel that highlights where stop runs and failed breakouts tend to concentrate, making it useful for both discretionary traders and systematic trading strategy rules.
How to Trade the Rolling Liquidity Clusters Channel Trading Indicator
This trading indicator draws a three-line channel designed to show where liquidity is clustering and where price is most likely to react.
- Upper Level (Red): A dynamic resistance zone built from the densest concentration of upper-wick rejections, while ensuring no candle body in the lookback window crosses above the level.
- Lower Level (Green): A dynamic support zone built from the densest concentration of lower-wick rejections, while ensuring no candle body in the lookback window crosses below the level.
- Mid Level (Orange): The channel’s equilibrium, representing the average balance point between the current support and resistance liquidity clusters.
Because these levels are derived from repeated rejection (wicks) and strict “no-body-cross” rules, the channel often acts like a liquidity magnet and boundary: price can probe it, sweep it, and reject it—but it’s less likely to be a meaningless line that has already been invalidated by sustained closes.
Trading Strategy Ideas for Liquidity Channels
Use the channel as a practical framework for both mean reversion and breakout-style trading strategies:
-
Reversal / Mean Reversion Trades
- Look for price to tap the Upper Level and show rejection (long upper wick, bearish close, momentum slowing) to frame a short back toward the Mid Level.
- Look for price to tap the Lower Level and show rejection (long lower wick, bullish close, momentum reclaim) to frame a long back toward the Mid Level.
- This works especially well when the channel is stable and price is oscillating inside it—classic consolidation conditions.
-
Consolidation Mapping
- When price compresses and repeatedly tags both sides of the channel, the indicator is effectively showing you a liquidity box formed by historical rejection.
- The Mid Level becomes a helpful “fair price” reference for rotation-style trading and for filtering overtrading in chop.
-
Breakout and Market Structure Shifts
- A decisive move outside the channel can suggest a structural shift: price is moving beyond the most inclusive wick-based levels that were previously “unbroken.”
- In a trading strategy, this can be used as a trigger to stop fading moves and instead look for continuation setups, retests, or momentum confirmation before entries.
DETAILS
At the core, this tool is a constraint-driven liquidity algorithm. Instead of drawing levels from arbitrary pivots, it tries to locate the most meaningful boundaries where price reached but did not sustain.
Body-Crossing Constraint
To ensure the channel represents true untouched liquidity, the script first computes:
- The highest candle body high within the rolling window
- The lowest candle body low within the rolling window
This creates a “body zone” that represents where price has actually closed and held. The channel levels are then forced to stay outside that zone, meaning the plotted support/resistance levels represent prices that were tested by wicks but never validated by candle bodies. In liquidity terms, this helps isolate levels that behave like “rejection ceilings/floors” rather than already-broken areas.
Maximizing Touches
Once the body-crossing constraint is known, the indicator searches for the most statistically “inclusive” wick-based levels:
-
Upper Level logic: Find the lowest high that still remains above all candle bodies in the window.
This effectively maximizes the number of upper-wick touches while ensuring the level hasn’t been closed through. -
Lower Level logic: Find the highest low that still remains below all candle bodies in the window.
This maximizes the number of lower-wick touches while ensuring the level hasn’t been closed through.
This is what makes the channel a liquidity clusters tool: it is explicitly attempting to locate where rejection has clustered the most, without the level being invalidated by sustained trading through it.
Vertical Gradient Fills
The channel uses a vertical gradient fill to make liquidity strength intuitive at a glance:
- The upper fill fades from 90% transparency at the Upper Level (Red) to 100% transparency at the Mid Level
- The lower fill fades from the Lower Level (Green) toward the center
This creates a soft “glow” effect that emphasizes the outer boundaries—where liquidity rejection is most concentrated—while keeping the chart readable.
SETTINGS
These settings let you tune the liquidity channel for different trading styles, instruments, and timeframes.
- Window Size: Controls how many bars are used in the rolling calculation.
- Larger values produce smoother, more stable liquidity zones (useful for higher timeframe context and swing trading).
- Smaller values adapt quickly to recent price action (useful for scalping and fast intraday trading strategy rules).
- Upper Level: Adjust the color of resistance and its gradient styling for your chart theme.
- Lower Level: Adjust the color of support and its gradient styling for your chart theme.
- Mid Level: Adjust the equilibrium line color to make the mean/rotation target easier to see.
FAQ
What is the Rolling Liquidity Clusters Channel indicator?
It’s a liquidity-based trading indicator that builds a dynamic support and resistance channel by maximizing wick rejections while preventing any candle body from crossing the level inside a rolling window.
How is this different from normal support and resistance indicators?
Most support/resistance tools use pivots, highs/lows, or volatility bands. This indicator specifically targets liquidity clusters by focusing on where wicks repeatedly reject a price while candle bodies do not sustain beyond it—helping identify “untouched” levels.
Is this better for reversal trading or breakout trading strategies?
Both. In ranges, it can support mean-reversion trading strategies (fading the edges back to the mid). During expansion, a clean break outside the channel can be used as a regime shift filter for breakout and trend-continuation logic.
How do I access Rolling Liquidity Clusters Channel?
You can get access on the LuxAlgo Library for charting platforms like TradingView, MetaTrader (MT4/MT5), and NinjaTrader for free.
Free indicator
Get free access to this indicator on the platforms below.
The Library is free. Quant makes it yours.
Pull any concept or indicator into Quant: rebuild it, retune it, or turn it into a backtested strategy of your own.