Standard-deviation Channel Width
 By LuxAlgoMay 5, 2026
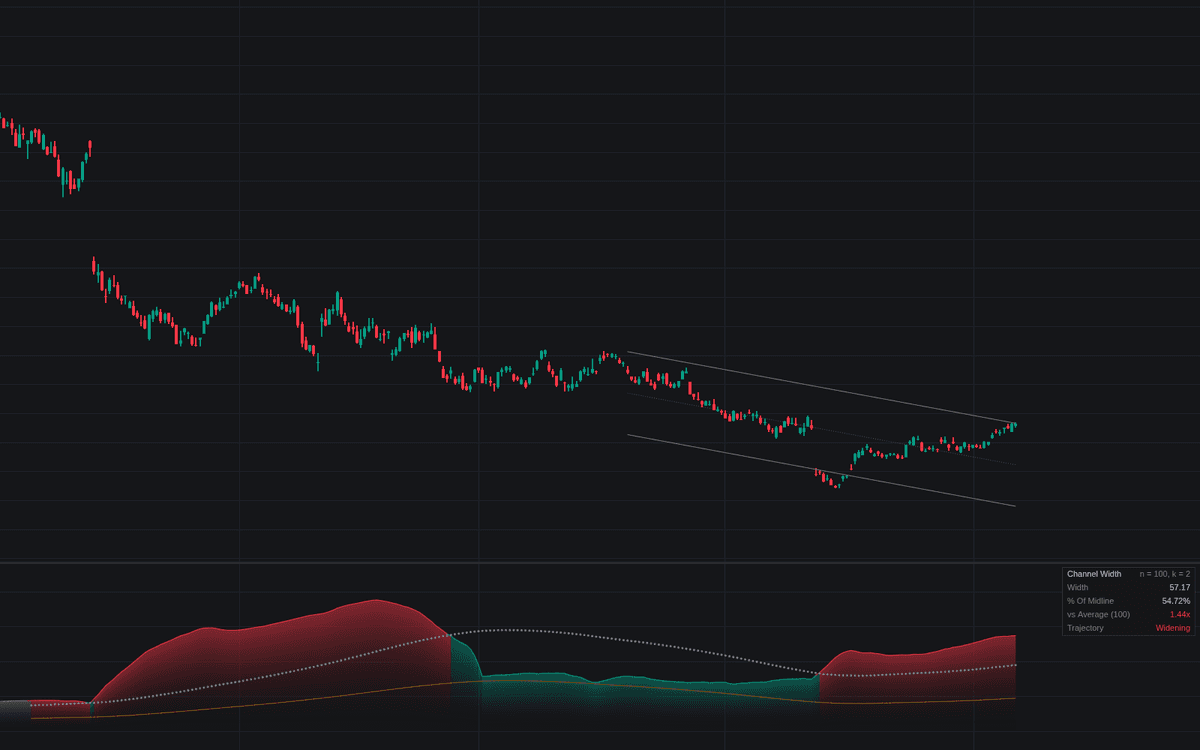

Standard-deviation Channel Width reads how tightly price hugs its own trend. Each bar it fits a least-squares regression over the lookback and measures the residuals' standard deviation, plotting the implied channel's rail-to-rail span, the standard-deviation channel width, as one line. With the trend subtracted first, the reading isolates the noise around a move rather than the move: an orderly trend prints narrow whether steep or flat. The width is judged against its own rolling average, compression tints the pane, and a dashboard restates the reading in price units, percent of midline, ratio to average and trajectory.
How to Trade the Standard-deviation Channel Width?
- Width below its average: an orderly, efficient trend; crossings are alerted both ways.
- Compression: readings under the threshold fraction of the average flag a coiled trend, with Start and Release alerts.
- Trajectory: the dashboard's 5-bar comparison reads Widening when a trend gets sloppy, Narrowing when it tightens.
Standard-deviation Channel Width Settings
- Regression Length (default 100) and Source (default close): the fitted window. Widths only compare at a fixed lookback.
- Deviation Multiplier (default 2.0): the k in rails at k standard deviations; scales the width linearly.
- Deviation Divisor (default n): population form, or the slightly wider n - 2 variant.
- Display Mode (default Normalized (% of midline)): percent of midline for comparability, or price units for sizing stops to the noise.
- Average Length (default 100) with Show Average (on); Compression Threshold (default 0.5) with Highlight Compression (on); Trajectory Lookback (default 5).
- Show Regression Channel (default off): draw the live channel on the price chart.
- Show Dashboard (on); style: Gradient Fill (on).
Frequently Asked Questions

The Library is free. Quant makes it yours.
Pull any concept or indicator into Quant: rebuild it, retune it, or turn it into a backtested strategy of your own.