Concept
Standard-deviation Channel Width
Standard-deviation Channel Width is a Volatility concept. The Library holds 1 implementation, a working definition you can pull into Quant.
Top Standard-deviation Channel Width indicator
The top custom implementation, built on the original standard Standard-deviation Channel Width formula.
1 total
The Standard-deviation Channel Width implementation below can become a backtested trading strategy — describe your rules and Quant writes the code.
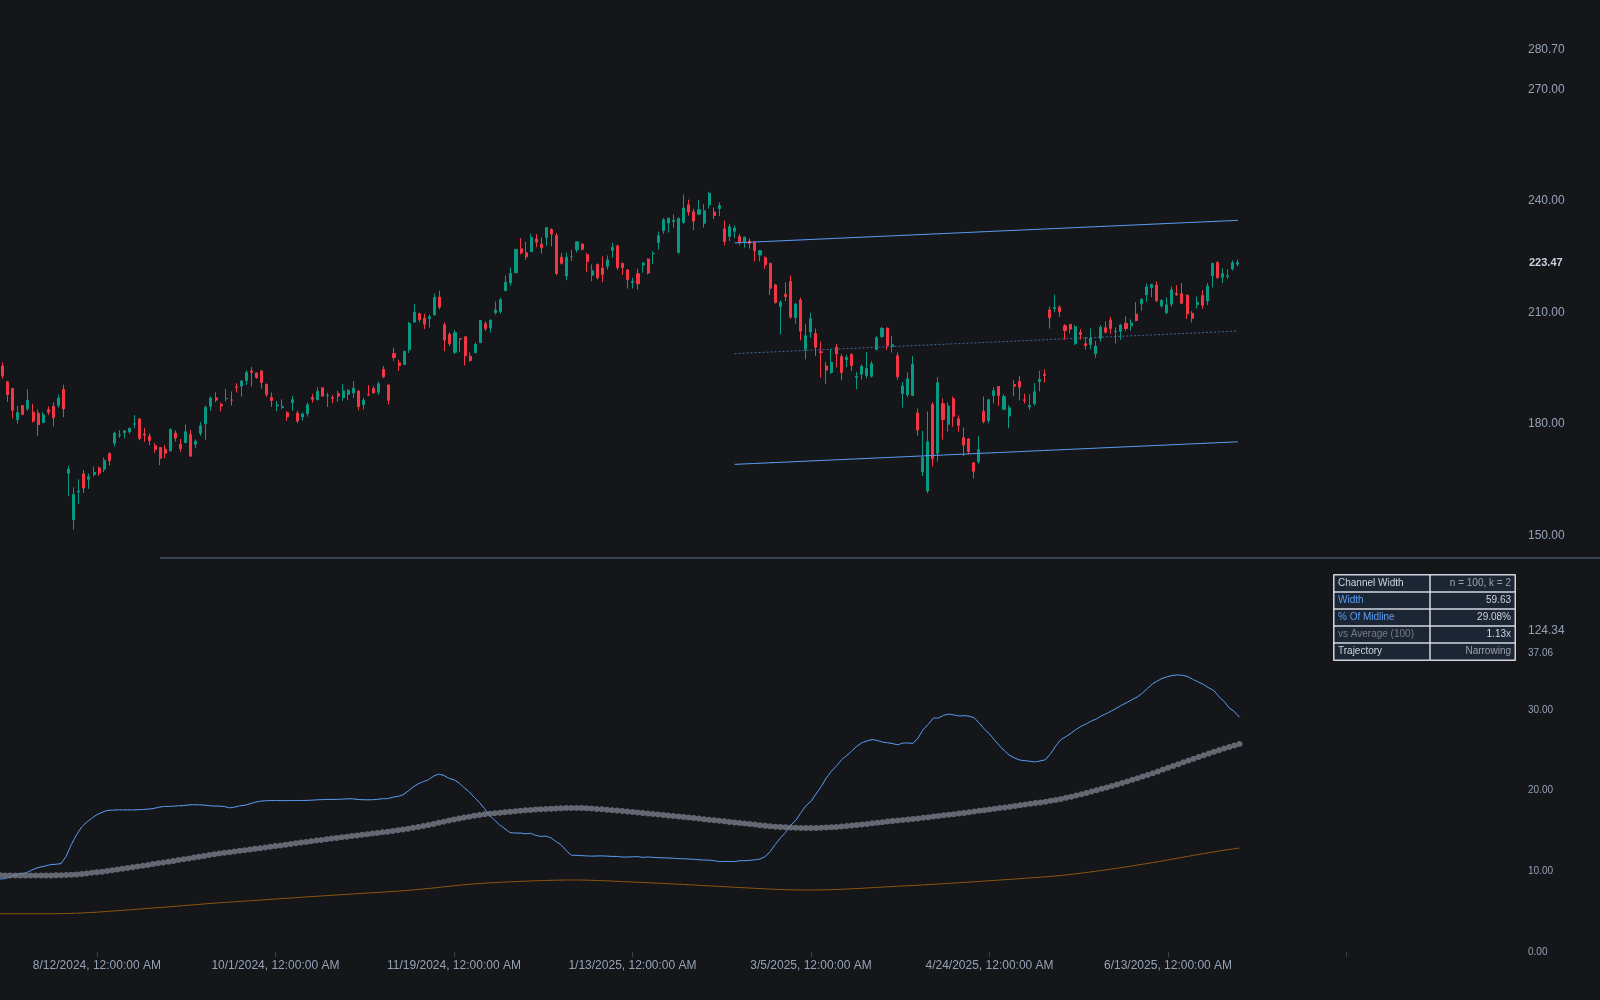
What is standard-deviation channel width?
Standard-deviation channel width is the distance between the rails of a linear regression channel whose bands are set a multiple of the standard deviation of residuals above and below the fitted line. Where the regression line summarizes the trend over the lookback, the width summarizes how loosely price has traded around that trend: a wide channel means large excursions from the fit, a narrow one means price has hugged its trendline.
The reason it exists as a distinct reading is that ordinary volatility measures conflate two different things: movement along a trend and movement around it. A steadily climbing market can post large daily ranges yet stay pinned to its regression line, printing a narrow channel. Detrending through the regression first isolates the noise component, which is often the part that matters for stop distance and pullback depth within an established trend.
Traders watch the width both as a level and as a trajectory. Narrowing width shows an increasingly orderly, efficient trend; widening width shows the trend loosening, which often precedes either a regime change or a transition into a trading range. Comparing the current width to its own history, in percent-of-price terms, keeps the reading meaningful across instruments.
How it's calculated
Fit a linear regression over the lookback, measure the standard deviation of residuals, and offset the rails by a multiple of it.
Some platforms divide by n - 2 rather than n when estimating residual dispersion; values differ slightly.
The whole fit is recomputed each bar, so past channel values repaint as the window rolls forward.
How traders use it
- As a trend-quality gauge: a narrow channel relative to its own history marks an orderly trend where pullback-to-the-line entries have tended to work; a widening channel warns that the trend is getting sloppy, similar in spirit to a falling Kaufman efficiency ratio.
- For stop and target scaling inside a trend: because the width measures typical excursion around the trend rather than raw movement, it sizes stops that tolerate normal noise without also absorbing the trend's own drift.
- As a compression screen on trending instruments: unusually narrow normalized width flags coiled trends, a complement to BandWidth, which measures compression around a moving average instead of a fitted line.
- Its main caveats: the reading depends heavily on the chosen lookback, the fit repaints as new bars arrive, and a linear fit is a poor model of a curving or rangebound market, in which case the width mostly measures model error.
Standard-deviation channel width vs related measures
Standard Error Channel: Standard error channels offset the rails by the standard error of the regression estimate, which shrinks with sample size, so they hug the line far more tightly than standard-deviation rails at the same lookback. The two widths answer different questions: dispersion of price versus uncertainty of the fit.
BandWidth: BandWidth measures Bollinger Band spread around a moving average, so it mixes trend drift into the dispersion when price is trending. Channel width detrends through the regression first, isolating movement around the trend.
Donchian Width: Donchian width is simply the highest high minus the lowest low of the lookback, dominated by the two extreme prints. Standard-deviation channel width uses every bar's residual, so single outliers move it far less.
Concept family
Volatility
57 concepts mapped · 57 in the Library
Standard-deviation Channel Width FAQ
Turn Standard-deviation Channel Width into a trading strategy.
Take the implementation from this page into Quant, then build on it, backtest it on real data, and keep refining it in conversation.