Ultimate RSI
 By LuxAlgoSep 1, 2023
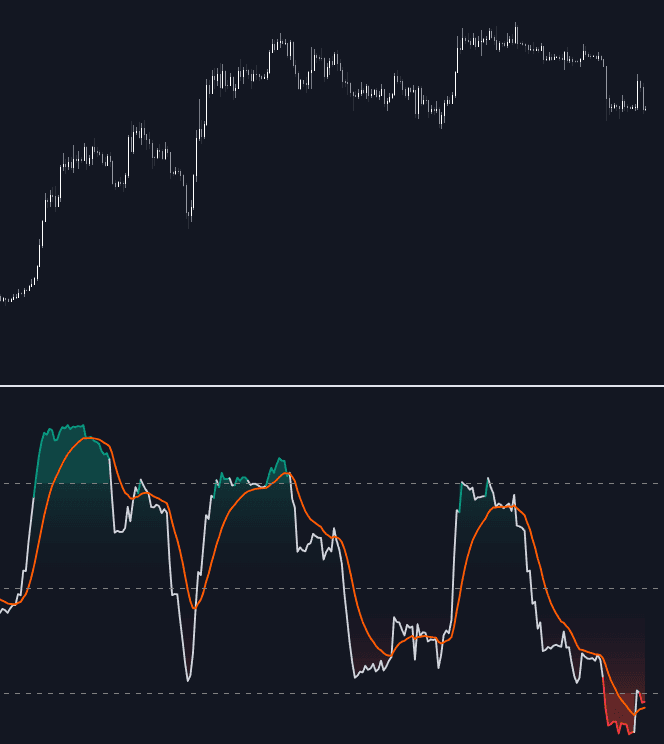

The Ultimate RSI is LuxAlgo's trend-first rebuild of the Relative Strength Index. Instead of weighting every price change equally, it substitutes the rolling range into the calculation, so movement that prints new highs or lows counts for more. The oscillator reaches overbought and oversold faster, holds those zones through sustained moves, and crosses its 50 midline less often than the classic version, an adaptive RSI design built for trend traders rather than contrarians.
How to Trade the Ultimate RSI?
- Cross above the overbought threshold: momentum strong enough to signal a robust uptrend, highlighted as a green area.
- Cross below the oversold threshold: a potent downtrend, marked in red.
- 50 midline position: above 50 favors upside, below 50 downside, and fewer midline crossings mean fewer false direction flips.
- Signal line alignment: the oscillator above its signal line indicates a strengthening trend; below it, momentum is fading.
Where the standard oscillator punishes trend followers by tagging its thresholds and snapping back, the Ultimate RSI is designed to sustain extreme readings: overbought becomes strength to follow, not an automatic fade.
Ultimate RSI Settings
- Length: the calculation period, which also sets the window used to assess new highs and lows.
- Method: smoothing method for the oscillator: EMA, SMA, RMA, or TMA, ranked from most reactive to smoothest.
- Source: the input series the oscillator runs on.
- Smooth: degree of smoothing applied to the signal line.
- Method (signal line): the smoothing method used for the signal line.
Frequently Asked Questions
Free indicator
Get free access to this indicator on the platforms below.

The Library is free. Quant makes it yours.
Pull any concept or indicator into Quant: rebuild it, retune it, or turn it into a backtested strategy of your own.