Upside/downside Tasuki Gap
 By LuxAlgoApr 22, 2026
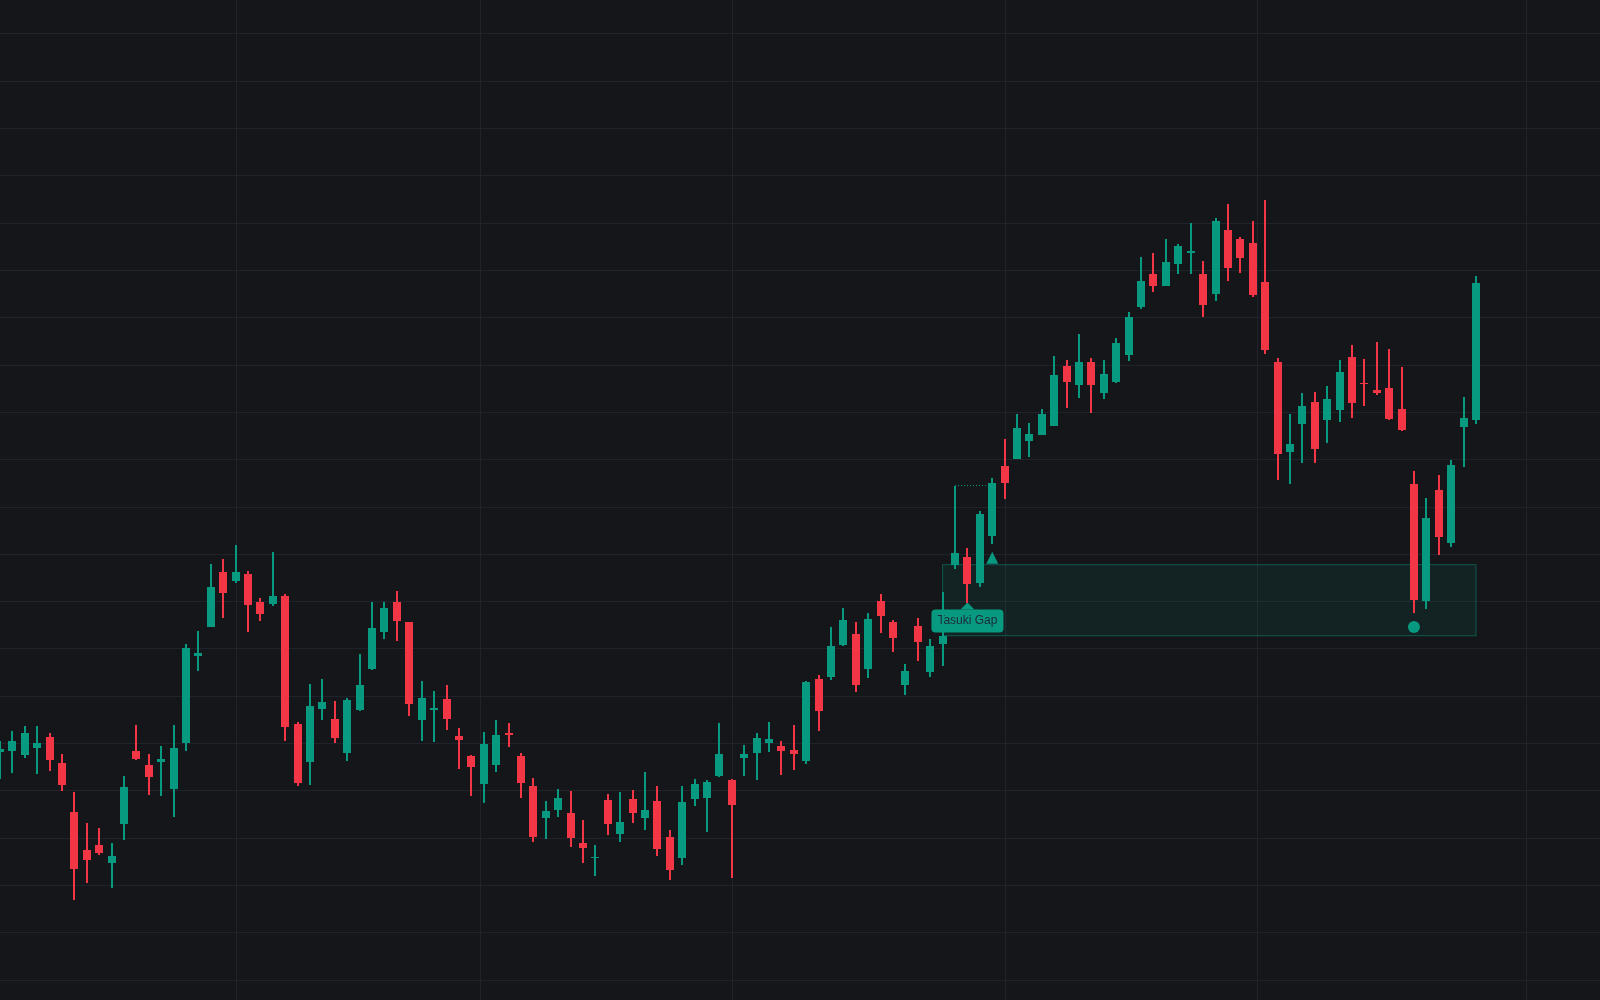

Upside/downside Tasuki Gap detects the three-candle gap-defense continuation in both directions, then manages the gap itself. Two trend candles split by a real gap, then an opposite-colored third that opens inside the second candle's real body and presses into the void without filling it, complete the classic tasuki gap; a trend filter keeps each form in its trend. Each pattern leaves its unfilled gap as an extending zone plus a dotted confirmation level.
How to Trade the Upside/downside Tasuki Gap?
- Continuation confirmed: price beyond the second candle's extreme (any trade or a close, per the Confirmation Basis) resumes the trend; triangles and alerts cover both sides.
- Gap retest: the first pullback into the unfilled zone after price has left it prints a circle. Defense expected on first touch, with alerts.
- Gap filled: a close that clears the entire gap voids the pattern. Zone greys out, x-cross prints, fill alerts fire.
Upside/downside Tasuki Gap Settings
- Upside Tasuki Gaps and Downside Tasuki Gaps (both on): which form to detect.
- Gap Basis (default Candle Bodies): the classical body-gap definition; Full Range (Wicks) also requires non-overlapping shadows.
- Elevated Gap Volume (default off), Volume Average Length (default 20), Volume Multiplier (default 1): optional volume preference on the gapping candle.
- Trend Filter (default SMA) and Trend Length (default 50): context the first candle must close beyond; None removes it.
- Confirmation Basis (default High/Low), Show Gap Zones (on), Show Confirmation Levels (on), Zone Extension Limit (default 250): the zone engine.
- Markers: Show Pattern Labels, Confirmation Markers, Retest Markers, Invalidation Markers (all on); Show Trend MA (off).
Frequently Asked Questions

Original indicatorBuilt in-house by LuxAlgo
The Library is free. Quant makes it yours.
Pull any concept or indicator into Quant: rebuild it, retune it, or turn it into a backtested strategy of your own.