Concept
Upside/downside Tasuki Gap
Upside/downside Tasuki Gap is a Chart & Candlestick Patterns concept. The Library holds 1 implementation, a working definition you can pull into Quant.
Top Upside/downside Tasuki Gap indicator
The top custom implementation, built on the original standard Upside/downside Tasuki Gap formula.
1 total
From studying Upside/downside Tasuki Gap to trading it: take the implementation below into Quant and backtest it instantly.
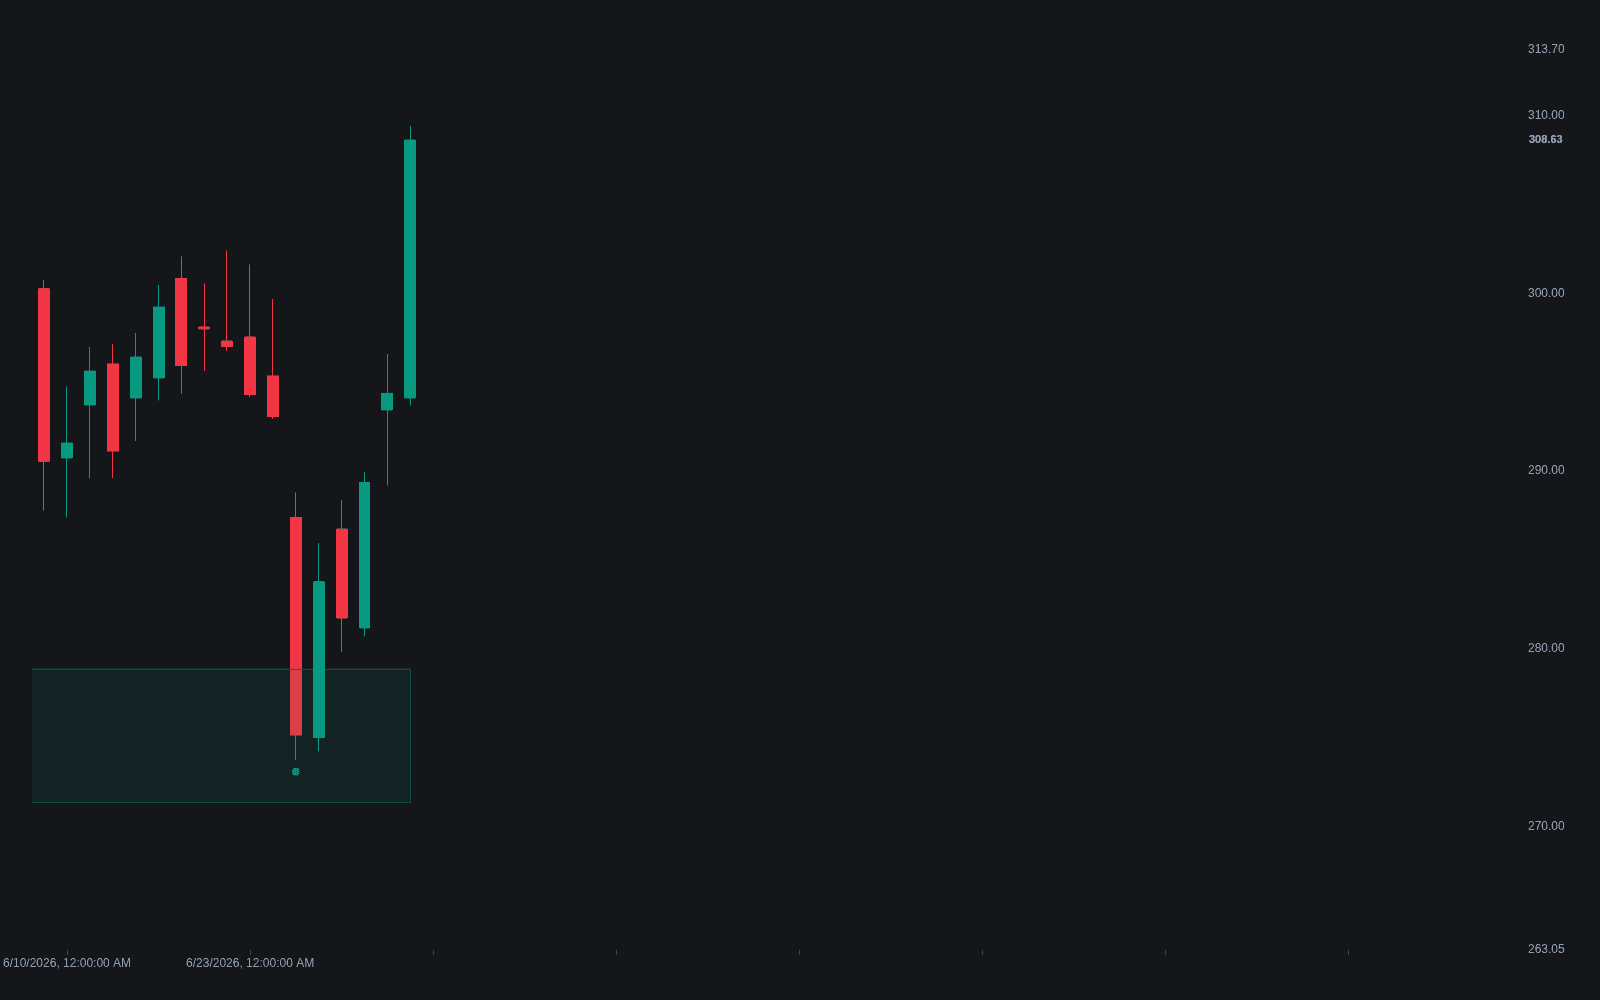
What are Upside and Downside Tasuki Gaps?
The tasuki gap is a three-candle continuation pattern from Japanese candlestick analysis. The upside version prints in an uptrend: a white candle, a second white candle gapping higher, then a black candle that opens inside the second body and closes into the gap without filling it. The downside version mirrors this in a downtrend with black candles and a white third candle. In both cases the third candle pushes against the trend, tests the gap, and fails to close it.
The gap is the information. A gap in the trend direction shows one-sided initiative, and the third candle is the counterattack: profit-taking or countertrend positioning pressing back into the void. When that press cannot fill the gap, the pattern reads it as evidence the gap is being defended, so the prior trend is expected to resume. The unfilled portion behaves like the support or resistance a runaway gap conventionally provides.
Steve Nison's work introducing candlestick charting to Western readers describes the tasuki gap as a continuation signal, while noting that the classical Japanese sources treated it as a relatively minor pattern. Modern pattern statistics broadly agree that its continuation tendency is modest and context-dependent, so most practitioners treat it as a gap-defense observation rather than a standalone system.
How to identify a tasuki gap on a chart
The pattern is defined by the gap surviving the third candle's test; a filled gap voids it.
- 1Confirm a trend: upside tasuki gaps belong in advances, downside in declines.
- 2Find two same-color candles in the trend direction separated by a real gap between their bodies.
- 3Require the third candle to be the opposite color, open within the second candle's body, and close inside the gap.
- 4Verify the gap is not fully closed; a complete gap fill invalidates the pattern.
- 5Prefer examples where the gap itself printed on elevated volume, consistent with genuine initiative rather than thin-market noise.
- 6Treat continuation as confirmed when price moves beyond the second candle's extreme in the trend direction.
How traders use it
- As a continuation entry in an established trend: classical usage enters in the trend direction after the third candle holds the gap, with invalidation placed beyond the far edge of the gap, since a full fill breaks the premise.
- The unfilled gap serves as a reference zone afterward; traders watch later pullbacks into it, expecting defense on first touch and treating acceptance through it as a character change.
- In 24-hour markets, strict tasuki gaps are scarce because true gaps rarely form; some traders apply the same logic to intrabar imbalances instead, accepting that this departs from the classical definition.
- Its limitations are real: the pattern is uncommon in strict form, its measured edge is modest, and a third candle probing a gap is routine behavior, so most treat it as supporting evidence within a trend thesis rather than a signal to initiate one.
Tasuki gaps vs. other gap continuations
Runaway Gap: A runaway gap is a mid-trend gap classified by its position in the move; the tasuki gap adds a specific three-candle script in which the gap is tested and defended immediately.
Rising/falling Three Methods: Both are candlestick continuation patterns, but three methods shows a multi-bar countertrend drift contained within one large candle's range, with no gap involved.
Mat Hold: The mat hold also opens with a gap in the trend direction, but its pullback lasts several small candles before continuation, whereas the tasuki gap resolves the test in a single third candle.
Concept family
Chart & Candlestick Patterns
84 concepts mapped · 84 in the Library
Upside/downside Tasuki Gap FAQ
Turn Upside/downside Tasuki Gap into a trading strategy.
Take the implementation from this page into Quant, then build on it, backtest it on real data, and keep refining it in conversation.