Volatility Signature Plot
 By LuxAlgoJul 29, 2026
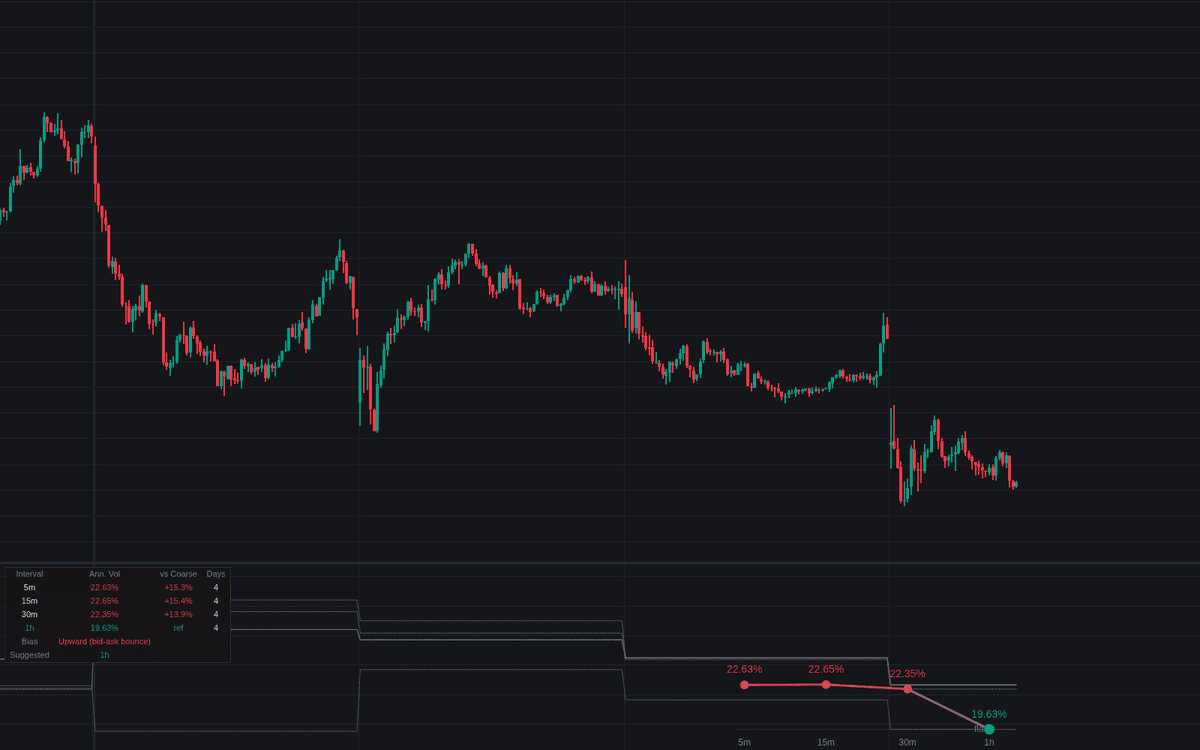

Volatility Signature Plot draws the econometric sampling diagnostic in the space beside price, a first for the library. Realized variance is measured from squared intraday returns at up to six intervals and averaged over completed days, plotted as a curve against interval, the volatility signature plot. A frictionless market would draw a flat line, so the bend at fine intervals is the diagnosis, colored point by point and summarized on a dashboard with a suggested sampling interval.
How to Trade the Volatility Signature Plot?
- Upward fine-end slope: fine-sampled variance runs above the coarse level, bid-ask bounce inflating high-frequency returns; alerted at onset.
- Downward slope: fine-sampled variance runs low, stale quotes or thin trading smoothing the feed; alerted.
- Suggested interval: the finest point still within tolerance of the coarse level is highlighted, the sampling that keeps the most data without absorbing microstructure bias.
- Flat signature: the whole grid inside tolerance, realized volatility insensitive to the sampling choice; alerted when it takes hold.
Volatility Signature Plot Settings
- Interval 1 (min)–Interval 6 (min) (defaults 1, 3, 5, 15, 30, 60), each with an enable toggle: the sampling grid.
- Days To Average (default 20): completed days per point; single-day plots are noise, and the dashboard reports the count used.
- Exclude Overnight Return (default on): keeps overnight jumps out of the intraday question.
- Flatness Tolerance % (default 10): drives both the bias diagnosis and the suggested interval.
- Output Units (default Annualized Volatility %) with Days Per Year (default 252).
- Display: Point Spacing (bars) (default 8), Rightward Offset (bars) (default 5), Show Flat Reference Line, Show Point Values, Show Dashboard (all on, Top Right, Small).
Frequently Asked Questions

Original indicatorBuilt in-house by LuxAlgo
The Library is free. Quant makes it yours.
Pull any concept or indicator into Quant: rebuild it, retune it, or turn it into a backtested strategy of your own.