Volume-adjusted Time
 By LuxAlgoApr 13, 2026
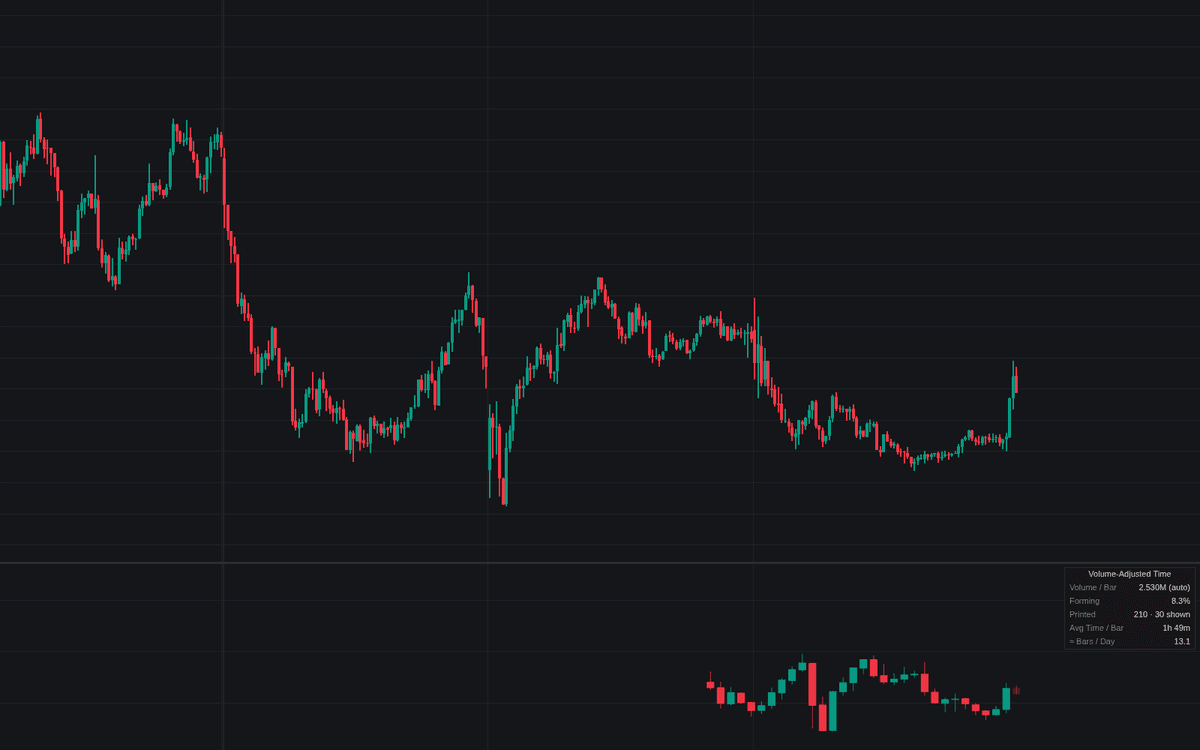

Volume-adjusted Time re-samples the chart onto a volume clock: a candle prints only when a set amount of volume has traded, so the horizontal axis measures participation rather than minutes. The build implements the sampling form of volume-adjusted time with a self-scaling threshold (average daily volume divided by a target bar count) and draws the strip in its own pane, at equal widths or stretched across the clock time each bar took to fill.
How to Trade the Volume-adjusted Time?
- Volume Axis mode: every candle carries the same participation. Busy periods expand, quiet drift compresses, and candlestick reads apply to information-uniform bars.
- Calendar Axis mode: bars keep their true time span, exposing where the volume clock ran fast against the calendar (narrow bars) or slow (wide bars).
- Print cadence: optional tick marks on the price chart record each print. Dense clusters flag an active tape; alerts cover every print, with bullish and bearish variants.
- Forming bar: a dotted preview fills toward the threshold, progress on the dashboard.
Volume-adjusted Time Settings
- Volume per Bar (default Auto (daily average / target bars)): the classic rule of thumb; Manual amount fixes it.
- Target Bars per Day (default 12) and Daily Volume Lookback (default 20): the auto threshold's inputs; Manual Volume per Bar (default 1000000) otherwise.
- Excess Volume (default Carry over): how overflow is handled.
- Chart Mode (default Volume Axis (equal width)).
- Display: Volume Bars Shown (default 200), Bar Spacing (default 3), Show Forming Bar (on), Mark Prints on Price Chart (off), Dashboard (on, Top Right, Small).
Frequently Asked Questions

Original indicatorBuilt in-house by LuxAlgo
The Library is free. Quant makes it yours.
Pull any concept or indicator into Quant: rebuild it, retune it, or turn it into a backtested strategy of your own.