Concept
Volume-adjusted Time
Volume-adjusted Time is a Meta & Composition concept. The Library holds 1 implementation, a working definition you can pull into Quant.
Top Volume-adjusted Time indicator
The top custom implementation, built on the original standard Volume-adjusted Time formula.
1 total
This Volume-adjusted Time implementation is strategy-ready: open it in Quant, set your rules, and it backtests automatically.
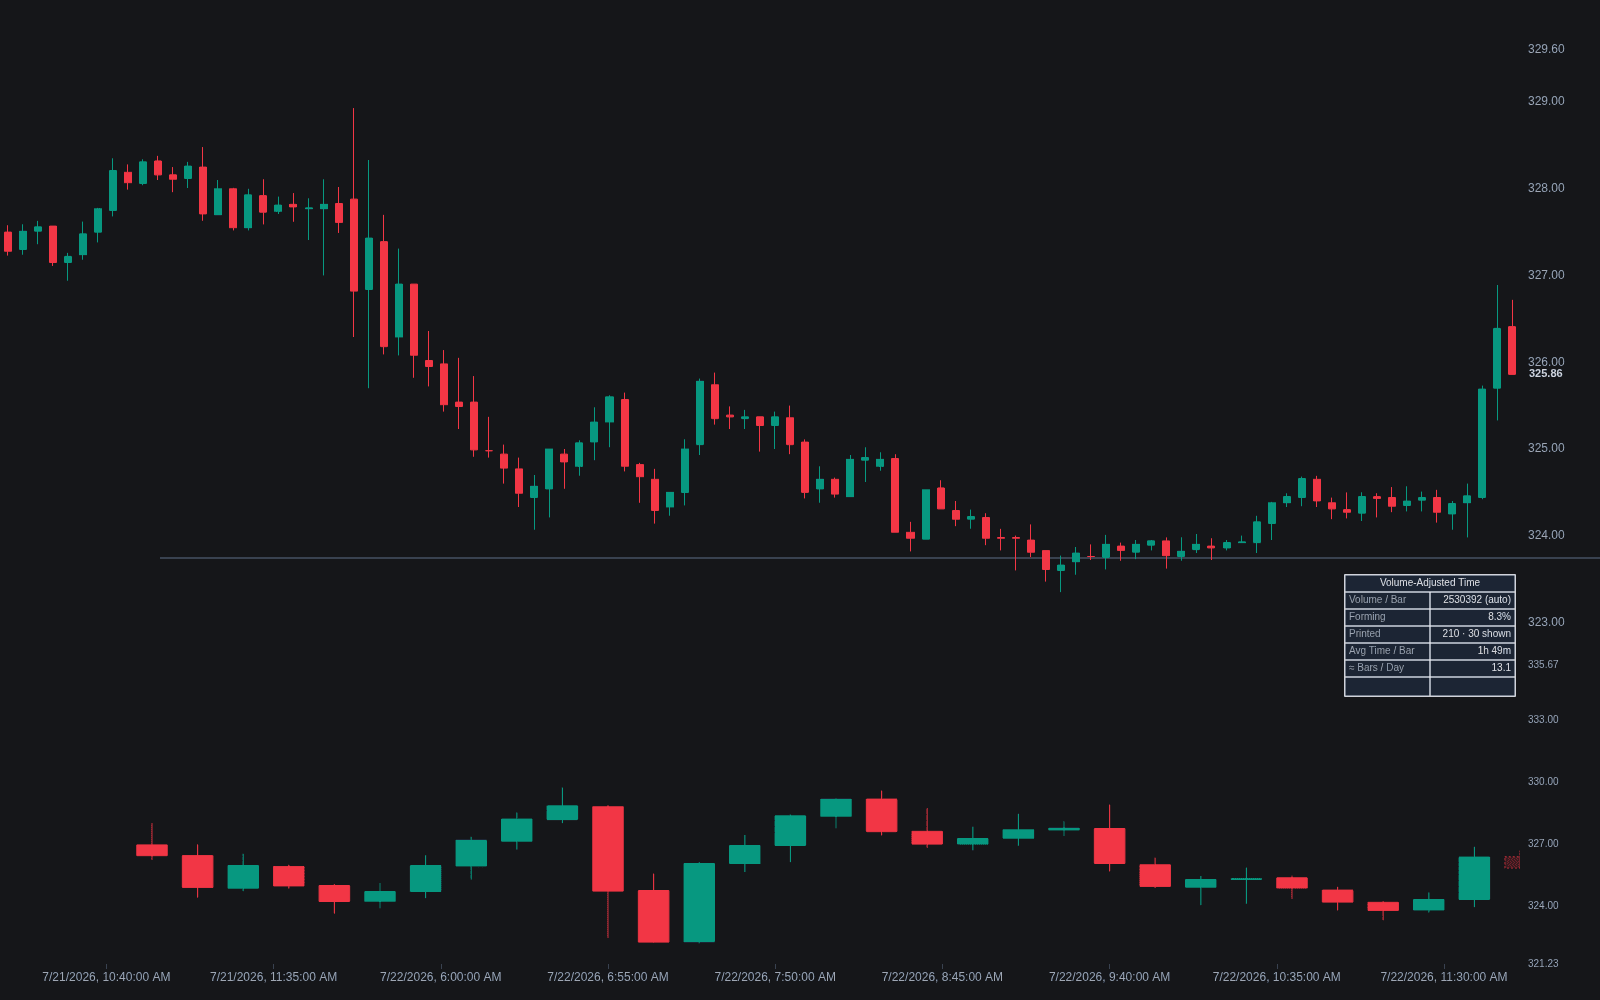
What is Volume-Adjusted Time?
Volume-adjusted time is a family of chart transforms that replace the clock with activity: instead of every minute or day receiving equal space on the horizontal axis, space is allocated in proportion to traded volume. Busy periods stretch out and quiet periods compress, so the chart's horizontal dimension measures participation rather than elapsed time. The idea appears in several forms, from Equivolume-style bars whose width scales with each bar's volume, to volume-based sampling where a new bar prints only after a fixed amount of volume trades, regardless of how long that takes.
The motivation is that clock time treats all periods as equally informative when they are not. A quiet overnight drift and a high-volume opening hour occupy identical space on a time chart, yet one contains far more transactional evidence than the other. Intraday volume also follows a strong recurring shape, heavy at the open and close and light through the middle, so fixed-clock bars systematically mix dense and sparse information. Sampling by volume instead of time tends to produce bars with more uniform information content, and returns measured in volume time are often closer to statistically well-behaved than clock-time returns.
The cost is comparability and intuition. Volume-adjusted charts desynchronize from the calendar, making it harder to align events, sessions, or other instruments, and the volume-per-bar parameter takes over the role the timeframe used to play. Volume data quality also matters more than usual: consolidated versus single-venue volume, or unreliable volume in decentralized markets, changes the chart itself.
How traders use it
- Volume-sampled bars for systematic work: printing a bar per fixed volume traded gives models more observations when the market is active and fewer when it is dead, which many quantitative practitioners find improves the statistical behavior of returns fed into models.
- Equivolume-style reading for discretionary charts: bar width as volume lets the eye weigh each move by participation, so a narrow breakout bar is instantly suspect while a wide one shows real involvement, complementing tools like relative volume.
- Normalizing the intraday cycle: because activity follows the recurring open-close pattern described in time-of-day effects, volume-based sampling removes that seasonality from bar formation instead of leaving each clock bar to inherit it.
- Filtering dead zones: in volume time, lunchtime chop and holiday sessions compress toward nothing, which reduces the noise trades a time-based system takes in inactive conditions.
- Honest limitation: the volume-per-bar setting is a genuine parameter that must scale with the instrument's typical turnover, and results change when volume regimes shift, so settings tuned in one activity regime can misbehave in another.
Volume-Adjusted Time vs related concepts
Equivolume: Equivolume is the classic charting implementation of the idea: time-based bars whose width is drawn proportional to volume. Volume-adjusted time is the broader principle, which also includes resampling bars by volume rather than merely redrawing their width.
Alternative Bar Types: Alternative bar types cover all non-time sampling schemes, including tick, range, and dollar bars. Volume-adjusted time is the subset that uses traded volume specifically as the clock.
Volume Profile: Volume profile redistributes volume across the price axis to find heavily traded levels. Volume-adjusted time redistributes it across the horizontal axis to reweight the sequence of bars; the two answer different questions and are often used together.
Concept family
Meta & Composition
28 concepts mapped · 28 in the Library
Volume-adjusted Time FAQ
Turn Volume-adjusted Time into a trading strategy.
Take the implementation from this page into Quant, then build on it, backtest it on real data, and keep refining it in conversation.