Williams A/D
 By LuxAlgoJun 3, 2026
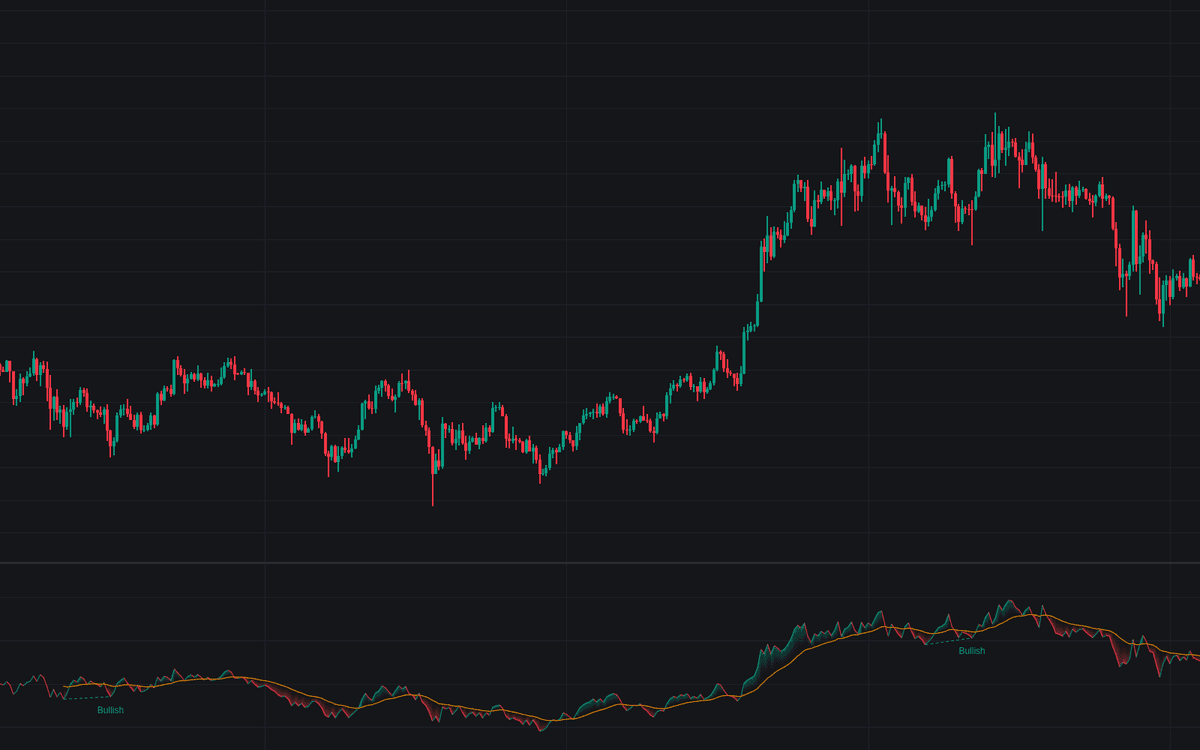

Williams A/D accumulates a simple per-bar verdict (how much ground the close won from the true low on up-closes, or surrendered from the true high on down-closes) into the running line Larry Williams read for quiet accumulation and distribution. This is the first faithful rendering of Williams A/D in its original price-only form: the line colors by its own direction, an optional moving average smooths it, and regular divergences against price are detected from pivots, drawn dashed and labeled.
How to Trade the Williams A/D?
- Bullish divergence: price stamps a lower low but the line bottoms higher, the primary application, alerted when the confirming pivot completes.
- Bearish divergence: a higher price high against a lower high on the line, likewise drawn and alerted.
- Smoothing crosses: the line crossing its moving average reads slope-regime turns after long drifts, with alerts both ways.
Only direction, slope and divergence carry information, never the absolute level.
Williams A/D Settings
- Volume-Weighted Variant (default off): the original uses no volume at all; enable to multiply each bar's contribution by volume.
- Smoothing Method (default EMA) and Smoothing Length (default 20): the moving average of the line; None disables it.
- Show Divergences (default on): draw and label regular divergences.
- Pivot Lookback (default 5): bars each side confirming a pivot on the line; higher values return more significant pivots, later.
- Maximum Pivot Distance (default 60): furthest apart two compared pivots may sit.
- Style: Directional Coloring (on) and Gradient Fill (on) between line and smoothing.
Frequently Asked Questions

Original indicatorBuilt in-house by LuxAlgo
The Library is free. Quant makes it yours.
Pull any concept or indicator into Quant: rebuild it, retune it, or turn it into a backtested strategy of your own.