Concept
Williams A/D
Williams A/D is a Volume & Order Flow concept. The Library holds 1 implementation, a working definition you can pull into Quant.
Top Williams A/D indicator
The top custom implementation, built on the original standard Williams A/D formula.
1 total
From studying Williams A/D to trading it: take the implementation below into Quant and backtest it instantly.
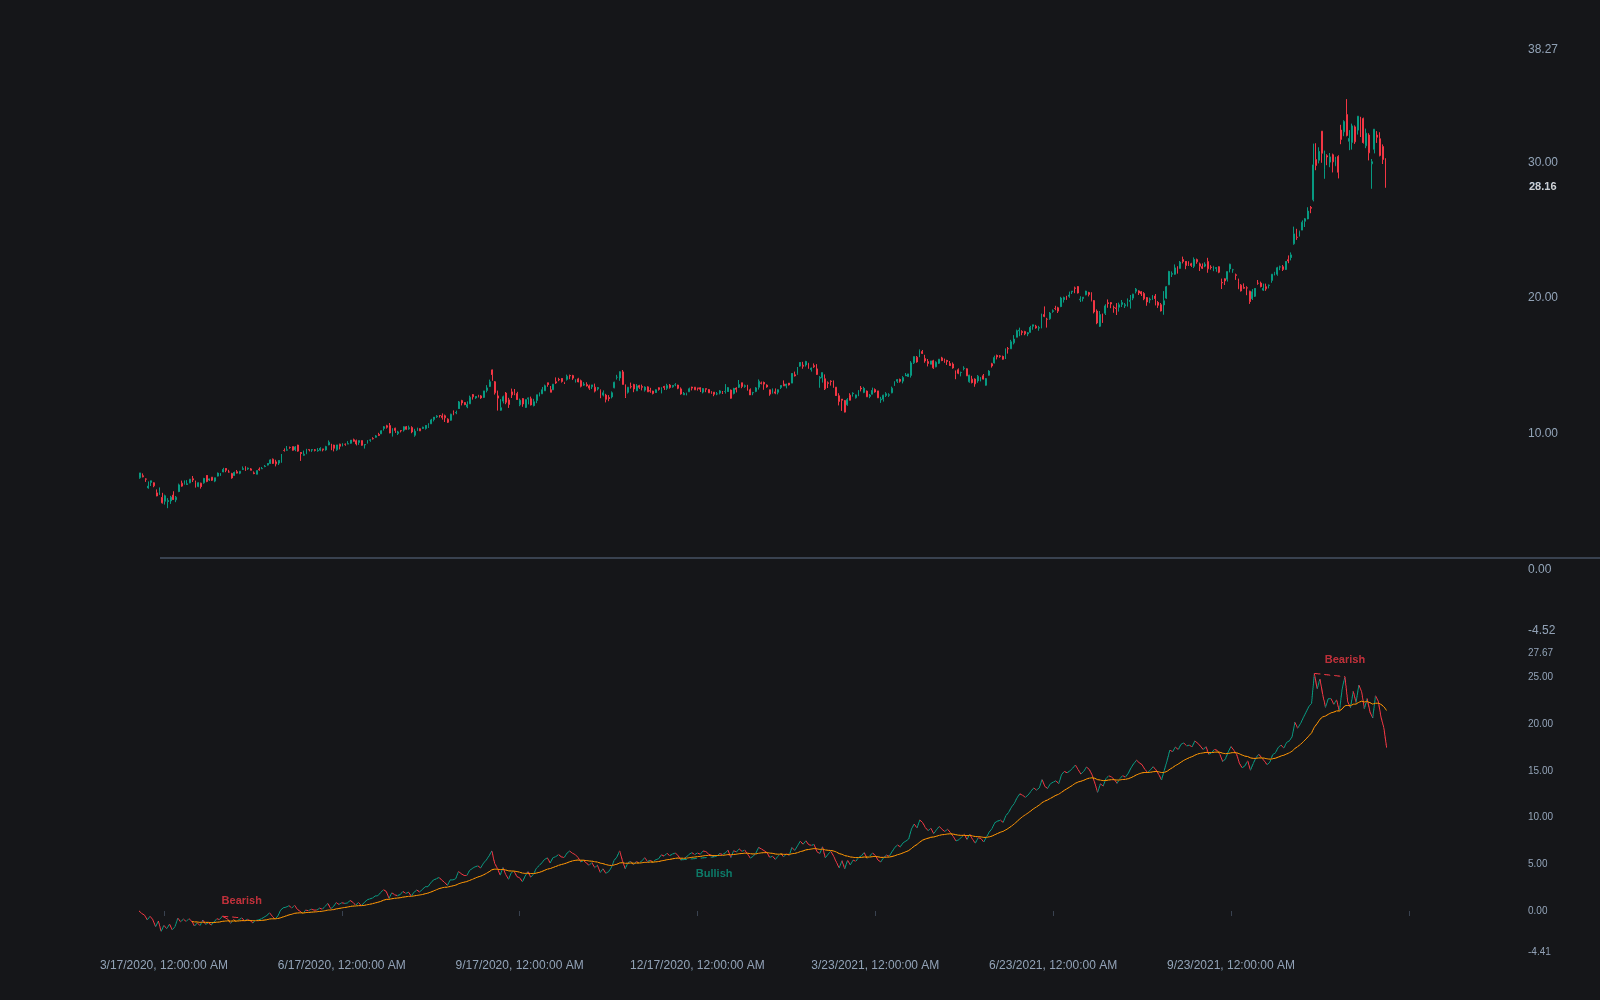
What is Williams A/D?
Williams A/D (Williams Accumulation/Distribution) is a cumulative running line developed by trader Larry Williams that adds a measure of buying pressure on up-closes and subtracts a measure of selling pressure on down-closes. Despite the accumulation/distribution name, the classic construction uses no volume at all: it is built purely from price, crediting each bar with the distance the close travels from a true low on up days and debiting the distance from a true high on down days. The result is a single line whose slope summarizes whether closes are consistently winning ground from the lows or losing ground from the highs.
The indicator exists to answer a Wyckoff-flavored question: is the instrument being quietly accumulated or distributed even while price looks range-bound? Because the line accumulates bar by bar, persistent one-sided pressure shows up as a steady slope, while a churning market produces a flat, choppy line. Its absolute value is meaningless; only direction, slope, and divergence against price carry information.
Traders care about Williams A/D almost entirely for divergence. When price prints a new high but the A/D line does not, the up-closes are no longer gaining ground from their lows, which is read as fading accumulation. The same logic applies in reverse at new lows. Like every cumulative line, it drifts with long trends and is not comparable across instruments, so it works as a confirmation and divergence tool rather than a standalone signal.
How it's calculated
Williams A/D is a cumulative line updated once per bar based on the direction of the close-to-close change.
On down bars the added term (close - true_high) is negative, so the line falls.
Some platform implementations multiply the per-bar term by volume; the original Larry Williams form is price-only. Check your platform before comparing readings.
How traders use it
- Divergence at extremes is the primary application: price makes a new high or low that the Williams A/D line fails to confirm, warning that the closes behind the move are losing force. Divergences can persist for a long time before price responds, so most traders pair them with a structural trigger.
- Trend confirmation: a rising line alongside rising price supports trend-following entries, while a flat line under a rising market suggests the advance rests on weak closes.
- Slope changes after long drifts are watched as early regime hints, similar to how OBV turns are read, though both lines lag at fast reversals.
- Because the line is price-only, some practitioners run it beside a volume-based flow line such as the Accumulation/Distribution Line and act only when both agree.
- The absolute level is not tradable information: the line has no bounds, no zero anchor of significance, and resets differently depending on chart history, so rules should reference slope and divergence only.
Williams A/D vs other cumulative lines
Accumulation/Distribution Line: Chaikin's A/D Line weights each bar by volume and by where the close sits inside the bar's range. Williams A/D ignores volume and measures close progress against true range extremes, so the two can disagree sharply on high-volume churn days.
OBV: OBV adds or subtracts the entire bar's volume based on close direction alone. Williams A/D grades how far the close traveled but ignores how much traded, so OBV is volume-sensitive and Williams A/D is range-sensitive.
Accumulative Swing Index: Wilder's ASI is another cumulative price-only line, but it scores each bar with a more elaborate open/close/limit-move formula intended for futures. Williams A/D is the simpler true-range-anchored version.
Concept family
Volume & Order Flow
88 concepts mapped · 88 in the Library
Williams A/D FAQ
Turn Williams A/D into a trading strategy.
Take the implementation from this page into Quant, then build on it, backtest it on real data, and keep refining it in conversation.