


In this series looking at chart patterns, we dive into the more complex study of harmonic patterns.
In this series of chart patterns, we have taken a look at the more traditional ones. However, we have not yet discussed harmonic patterns.
In this series of chart patterns, we have taken a look at the more traditional ones. However, we have not yet discussed harmonic patterns .
Harmonic patterns form a part of the numerous chart patterns available for the identification of reversal points. The practice of trading using harmonic patterns is often defined as "Harmonic Trading".
We felt like it was an appropriate time to discuss the popular bat harmonic pattern , defined as "The most accurate pattern in the entire harmonic trading arsenal" by Scott M. Carney (1).
"Suspicions in thoughts are like bats among birds."
- Translated from Francis Bacon.
Introduction
Unlike most traditional chart patterns, these patterns do not require breakouts of the price to be traded and involve the usage of precise Fibonacci ratios (highlighted below) for the identification of harmonic patterns . This makes harmonic patterns less subjective and pretty spooky. Wow.
Fibonacci Ratios
Fibonacci ratios are key components of harmonic patterns .
Fibonacci ratios are obtained from the Fibonacci sequence, whose nth element is obtained by adding the two previous numbers of the sequence. The sequence is as follows: 1, 1, 2, 3, 5, 8, 13, 21, 34, 55, 89, 144, 233..., and exhibits various mathematical characteristics.
One characteristic of interest is given by the ratios between elements in the sequence. The ratio of one element in the sequence with the following one approximately equals 0.618, while the ratio of one element in the sequence with the previous one approximately equals 1.618. These two values are often defined as golden ratios, with 1.618 being denoted as "Phi" (upper-case P) and 0.618 as "phi" (lower-case p).
The ratio between elements separated by two positions returns 0.382 and 2.618 respectively, calculating the ratio using a higher separation would return the series of Fibonacci ratios. These ratios are also given by raising the golden number with specific exponents.
Fibonacci Reflects Price Action
The rationale behind the usage of Fibonacci ratios with harmonic patterns (and other methodologies in general) is given by the presence of the Fibonacci Sequence in nature and certain organisms and structures, but more importantly in human behavior. If security prices reflect investor behaviors, it seems logical to find a connection with Fibonacci numbers. This is a common rationale used by technical analysts to justify the usage of Fibonacci ratios.
A few studies aimed to explain a potential connection between the Fibonacci sequence and financial markets and evidence obtained by Bhattacharya & Kumar provide further incisive research on this connection (2).
Harmonic Bat Patterns
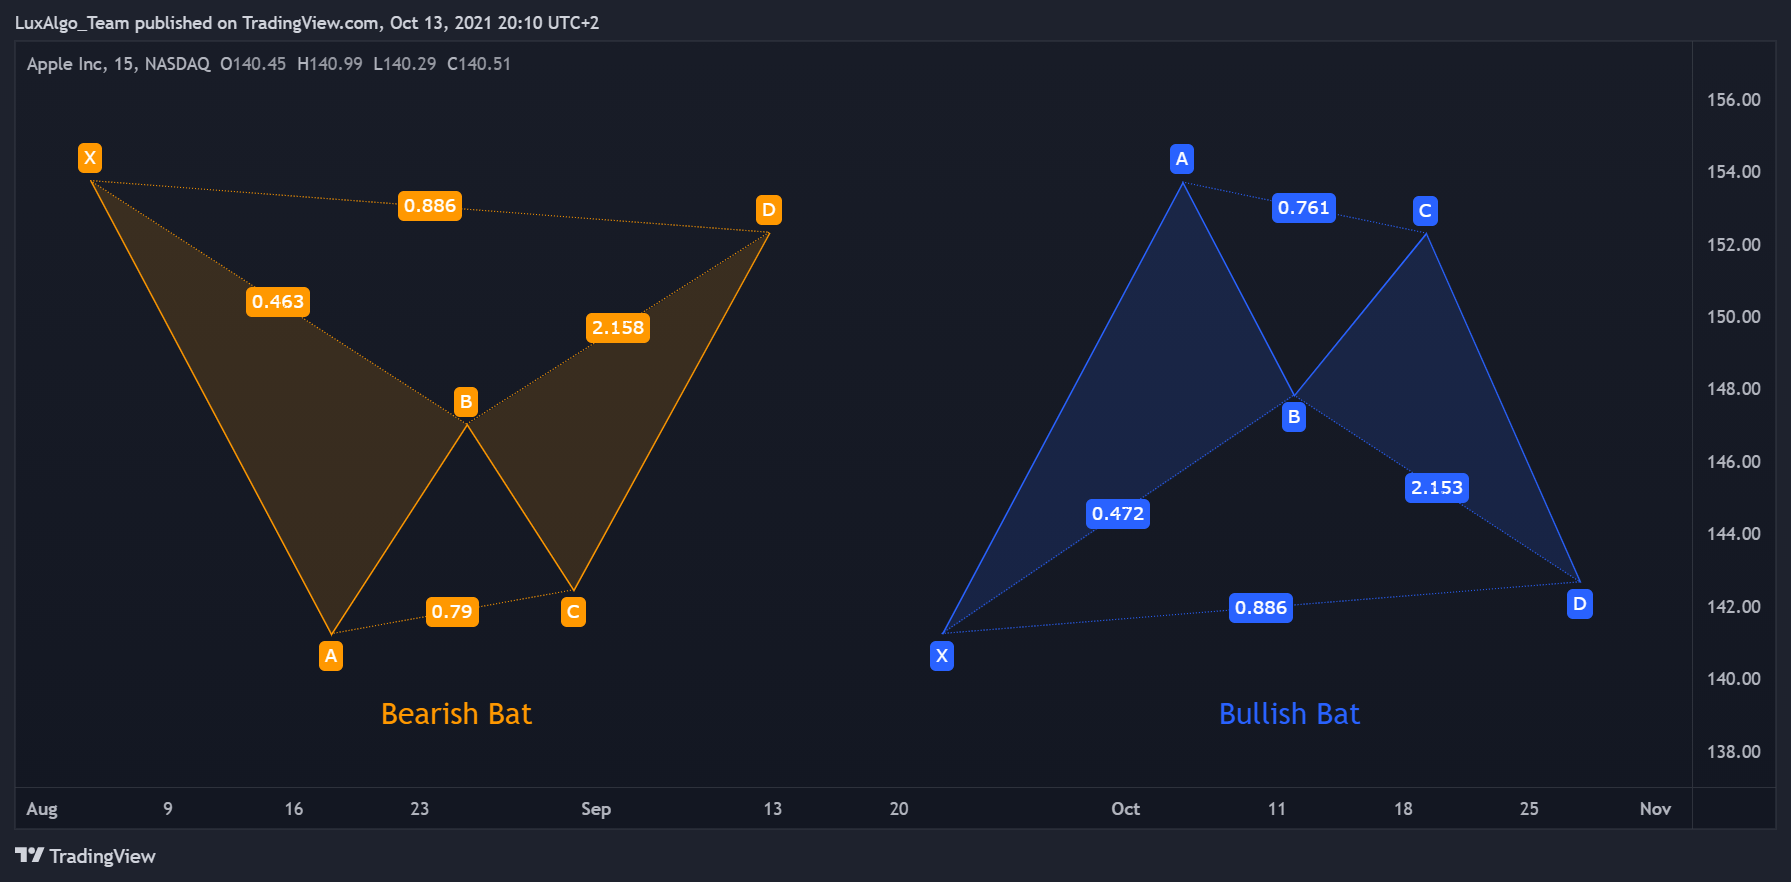
The bat harmonic pattern is built from 4 segments connecting points X, A, B, C, and D, each one located at a local maxima/minima of the price. The relative distance between the segments is used to determine the validity of a bat pattern ; these rules are defined as follows:
- 1 - Segment AB retraces within 38.2% and 50% of the XA segment (some less strict conditions only require a retracement within 38.2% and 61.8%).
- 2 - Segment BC retraces within 38.2% and 88.6% of the AB segment.
- 3 - Segment CD retraces within 161.8% and 261.8% of the segment BC .
- 4 - Segment AD is approximately equal to 88.6% of segment XA.
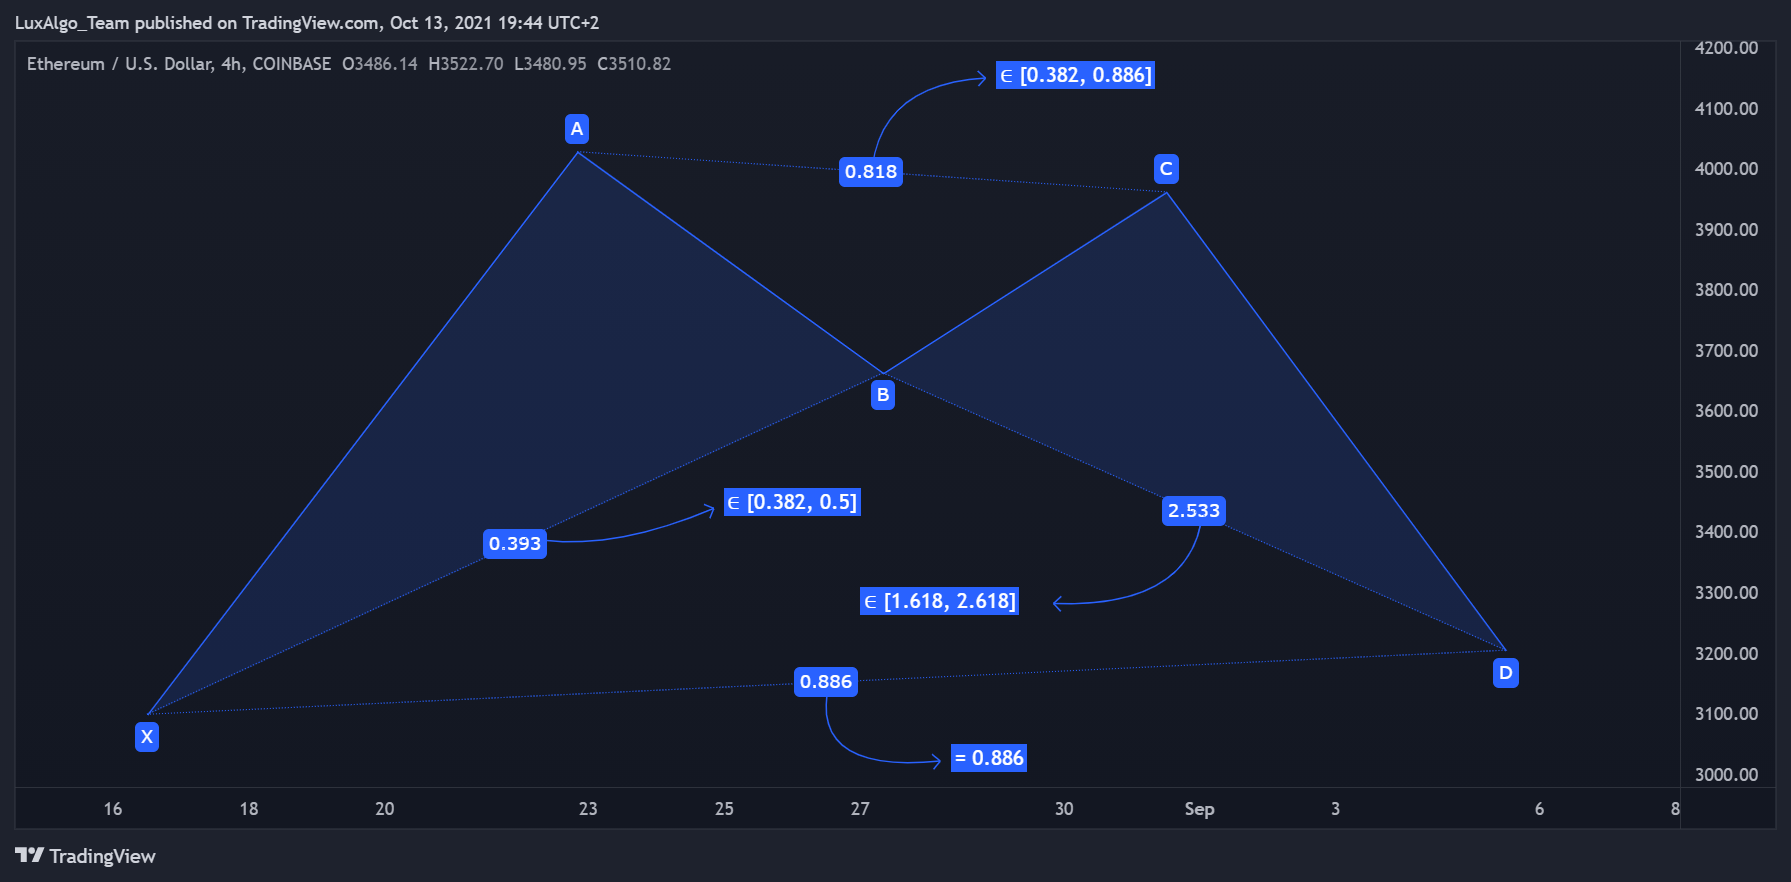
For the pattern to be valid, the vertex given by point C must be confirmed. It is also interesting to note that the bat pattern can possess an internal AB = CD pattern.
A reversal is more likely to occur within the "potential reversal zone" (PRZ). Traders can have different methods for identification however Fibonacci retracements are commonly used, with an extremity of the PRZ located at 88.6% of the internal retracement of XA and another at 161.8% of BC . Another method identifies the PRZ within 78.6% and 100% of the internal retracement of XA.
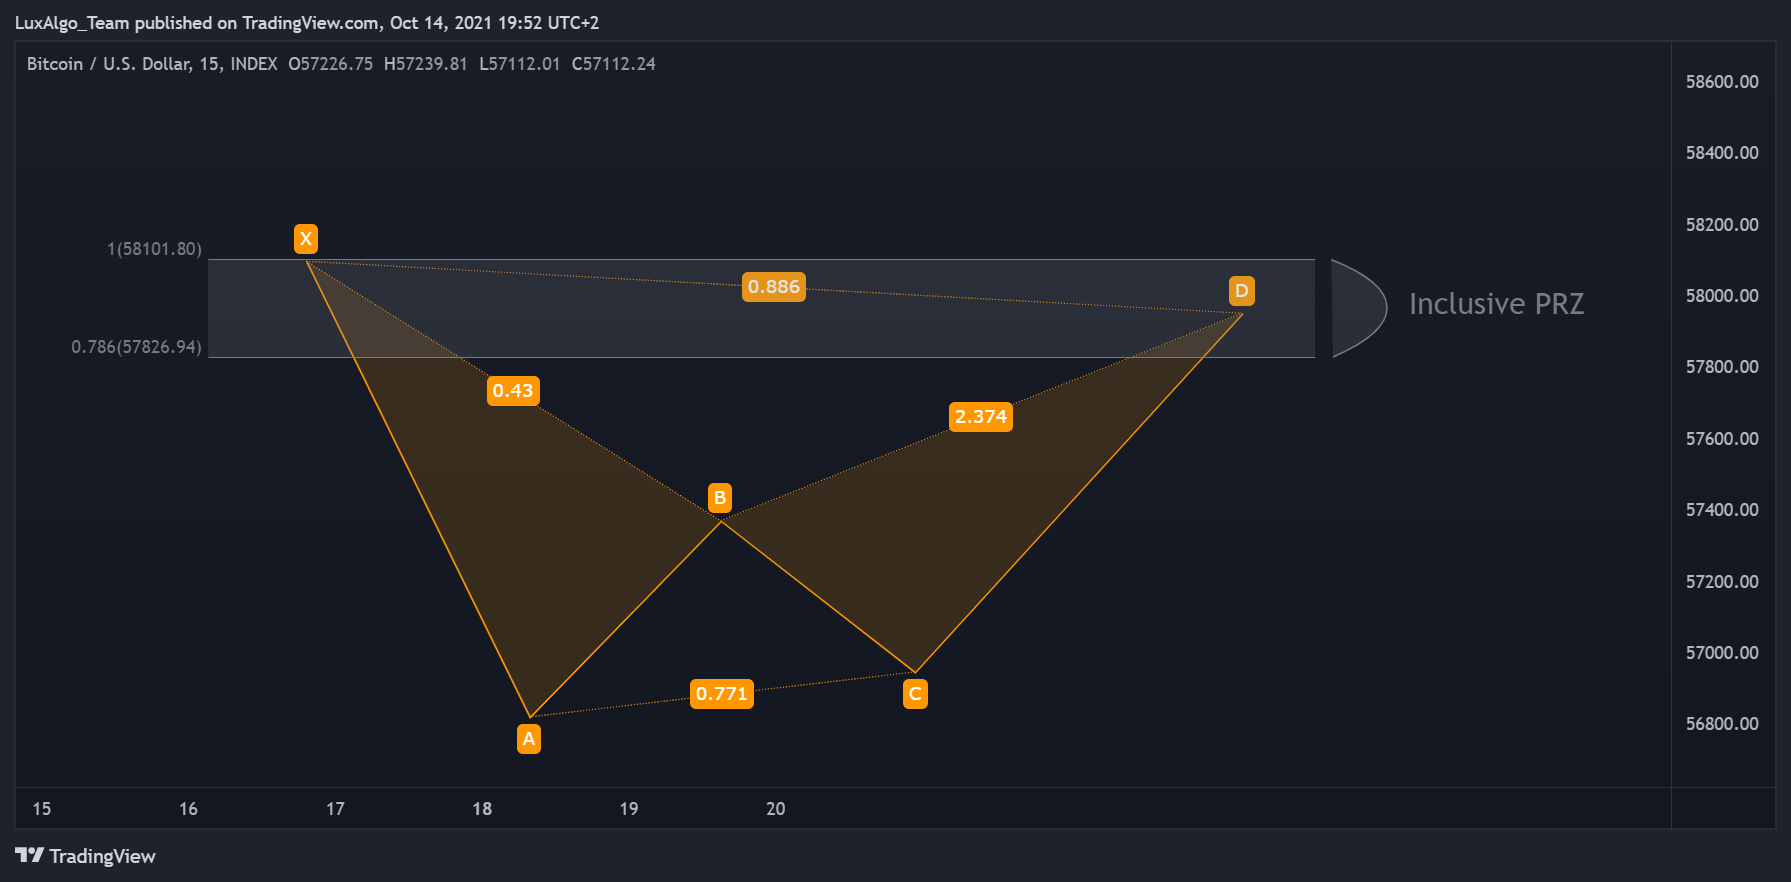
Some traders wait for additional confirmation before entering a position such as the occurrence of internal reversal patterns, oscillator divergences, or for the price to evolve outside the PRZ such that it implies that a reversal is occurring.
In Trading: Stop Loss & Take Profit Levels
Various techniques exist to set take profits and stop-loss levels during the formation of a bat pattern . Some traders place the stop loss at or a few ticks below X, which can lead to reduced risk but a higher risk of a premature trigger of the stop-loss. The usage of a very tight stop loss is mentioned by Scott M. Carney.
A take profit can be set at point A. Additional Fibonacci retracements might be used for partial exits.
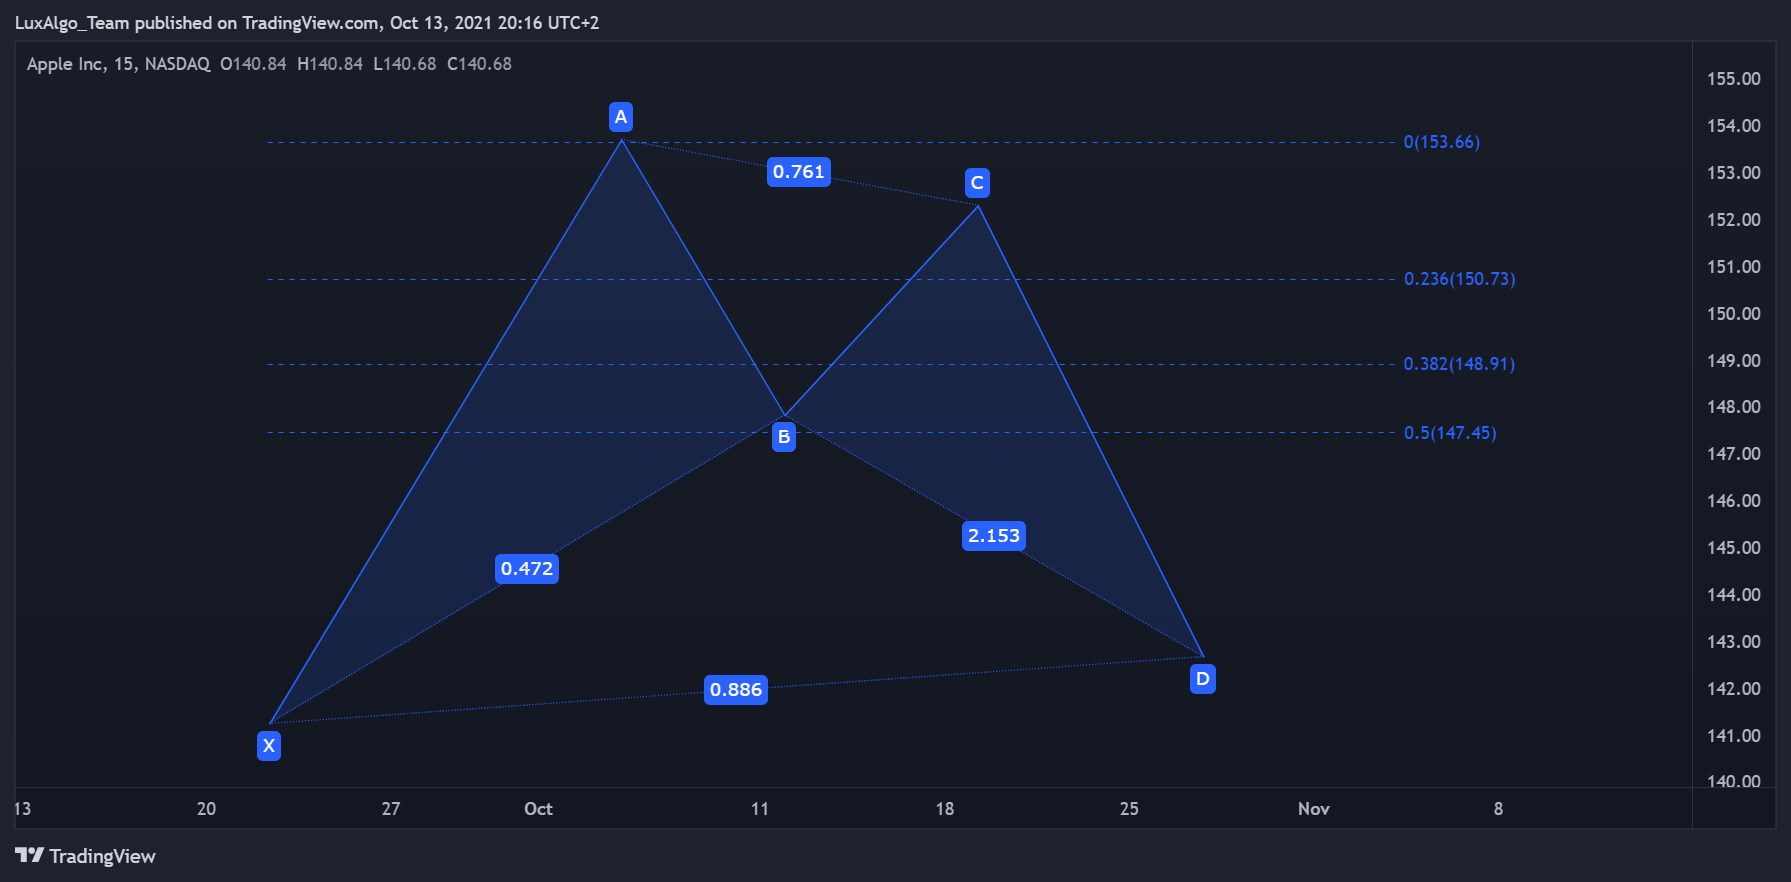
Practical Examples
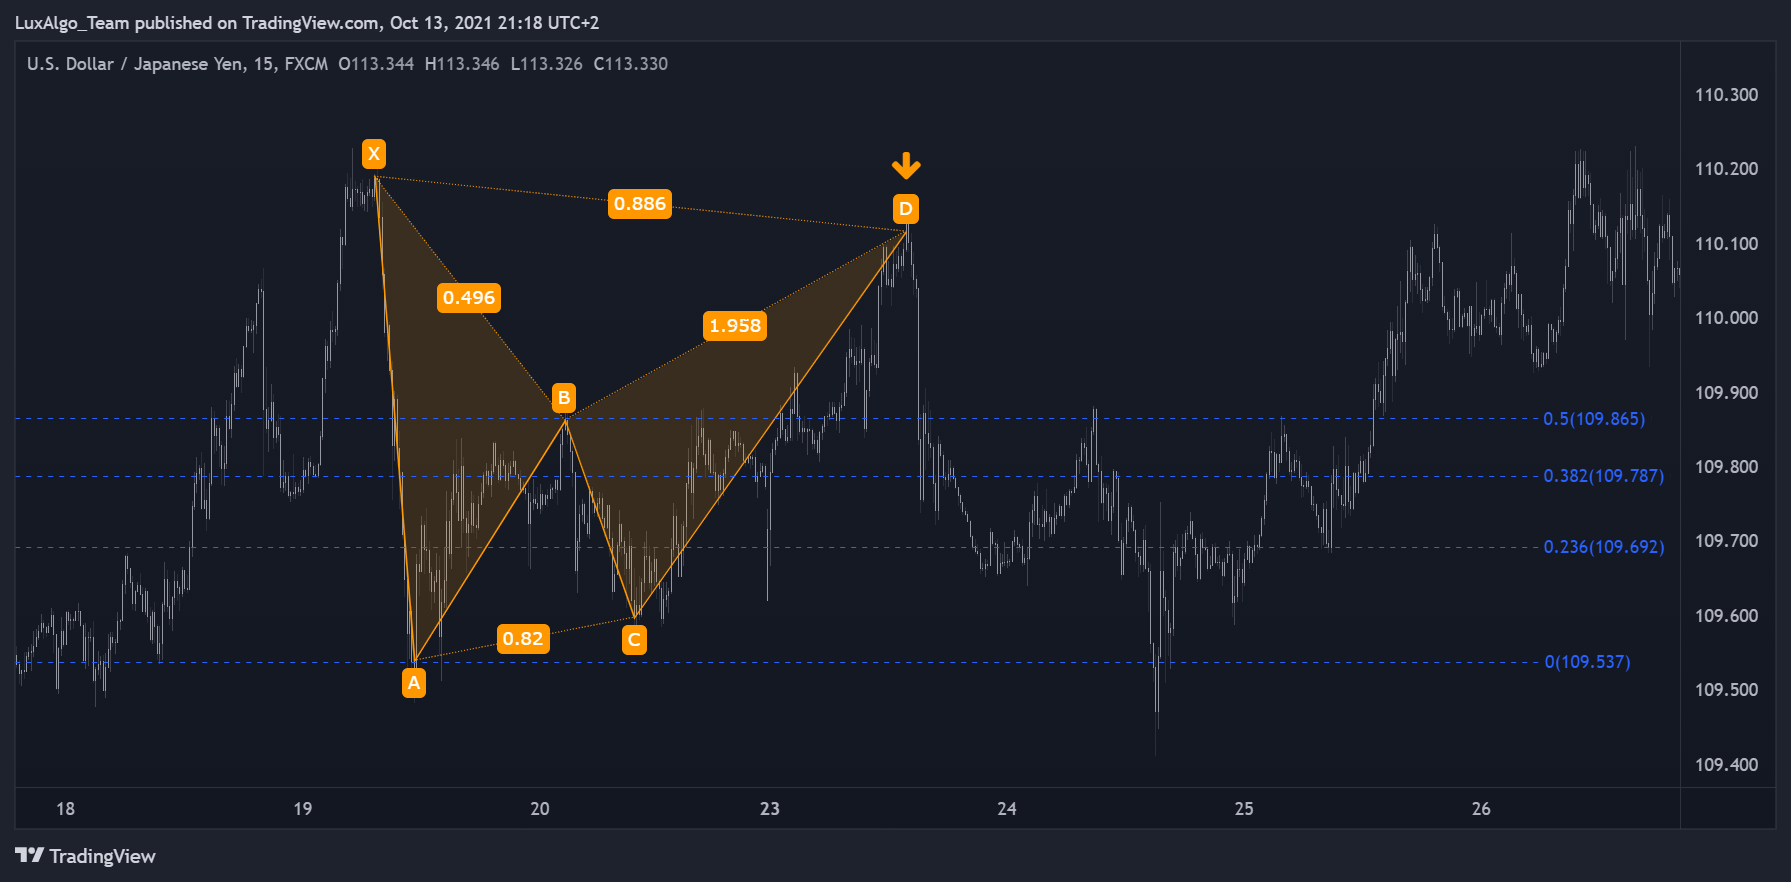
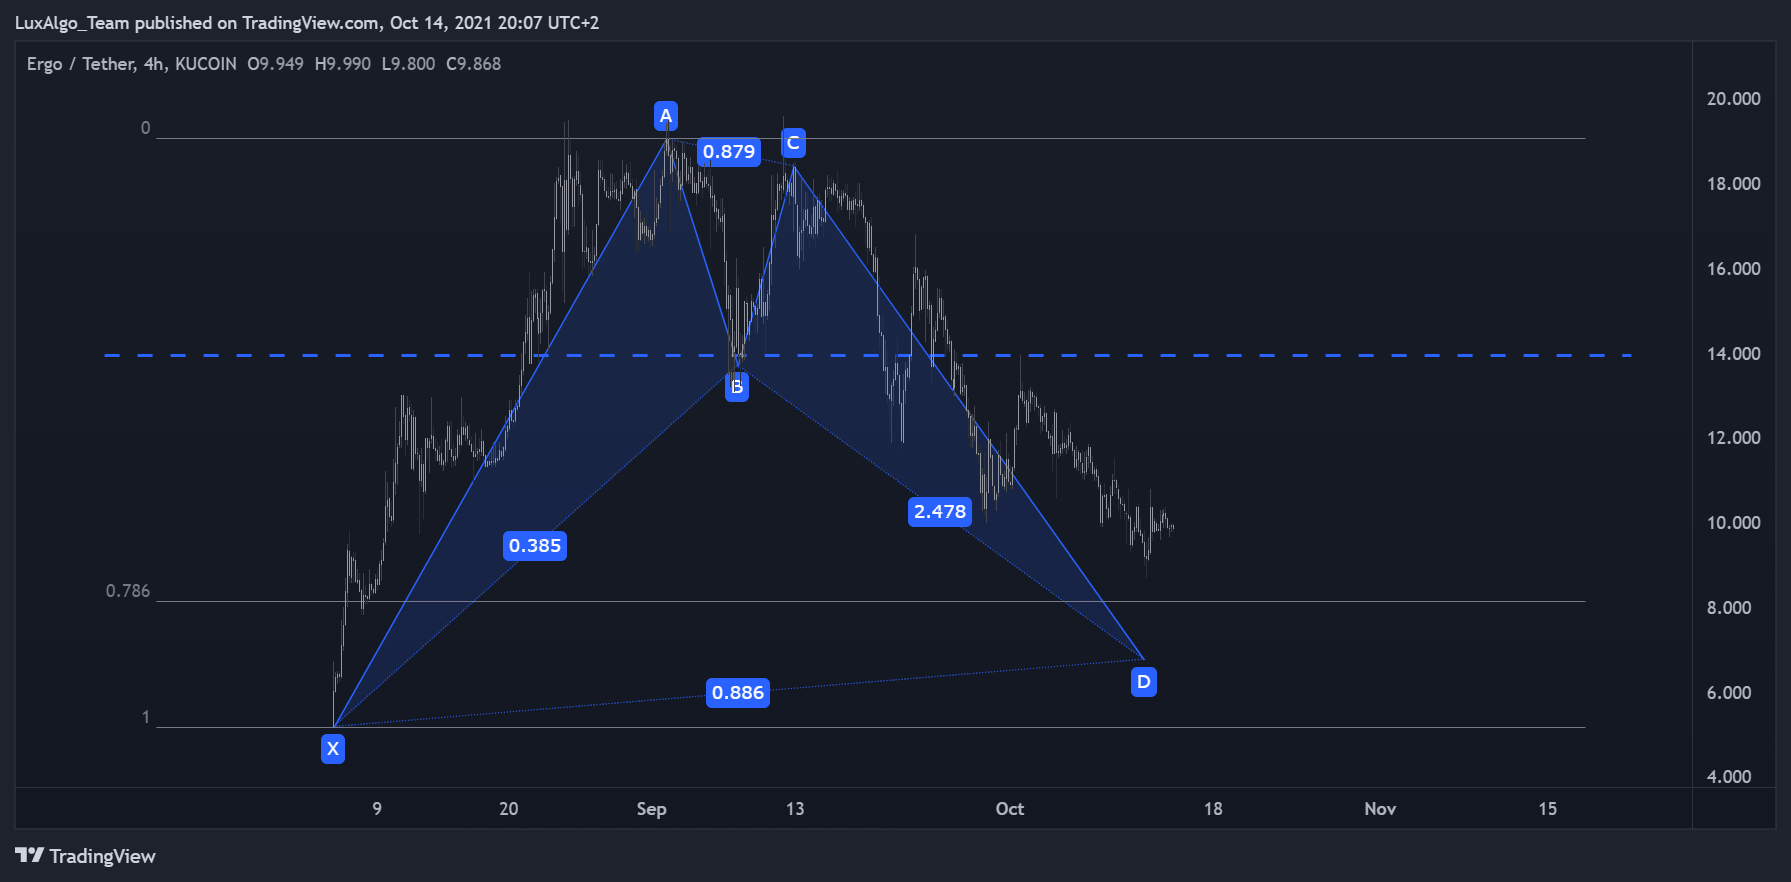
Observations
Oscillator divergences occurring when the price is within the PRZ can be an additional confirmation of a potential reversal occurring.
We found no studies proving data that the bat harmonic pattern is superior to other harmonic patterns .
One study by Krzysztof Bednarz highlights the profitability of the bat pattern in a trading period of 27 days (3).
Bulkowski shares statistics on how often price turns at point D (4). For Bullish Bats, the price reverses at point D 91% of the time, for Bearish Bat patterns the price reverses at point D 86% of the time. Super spooky...
References
(1) Carney, S. M. (2010). Harmonic Trading, Volume Two: Advanced Strategies for Profiting from the Natural Order of the Financial Markets. Pearson Education.
(2) Bhattacharya, S., & Kumar, K. (2006). A computational exploration of the efficacy of Fibonacci Sequences in technical analysis and trading. Annals of Economics and Finance, 7(1), 185.
(3) Bednarz, K. (2013). Taking investment decisions on the futurescontracts market with the application of Bat harmonic pattern – the increased efficiency of investment.
(4) Bulkowski, T. N. (2021). Encyclopedia of chart patterns. John Wiley & Sons.