Bullish vs. Bearish Continuation Patterns Explained
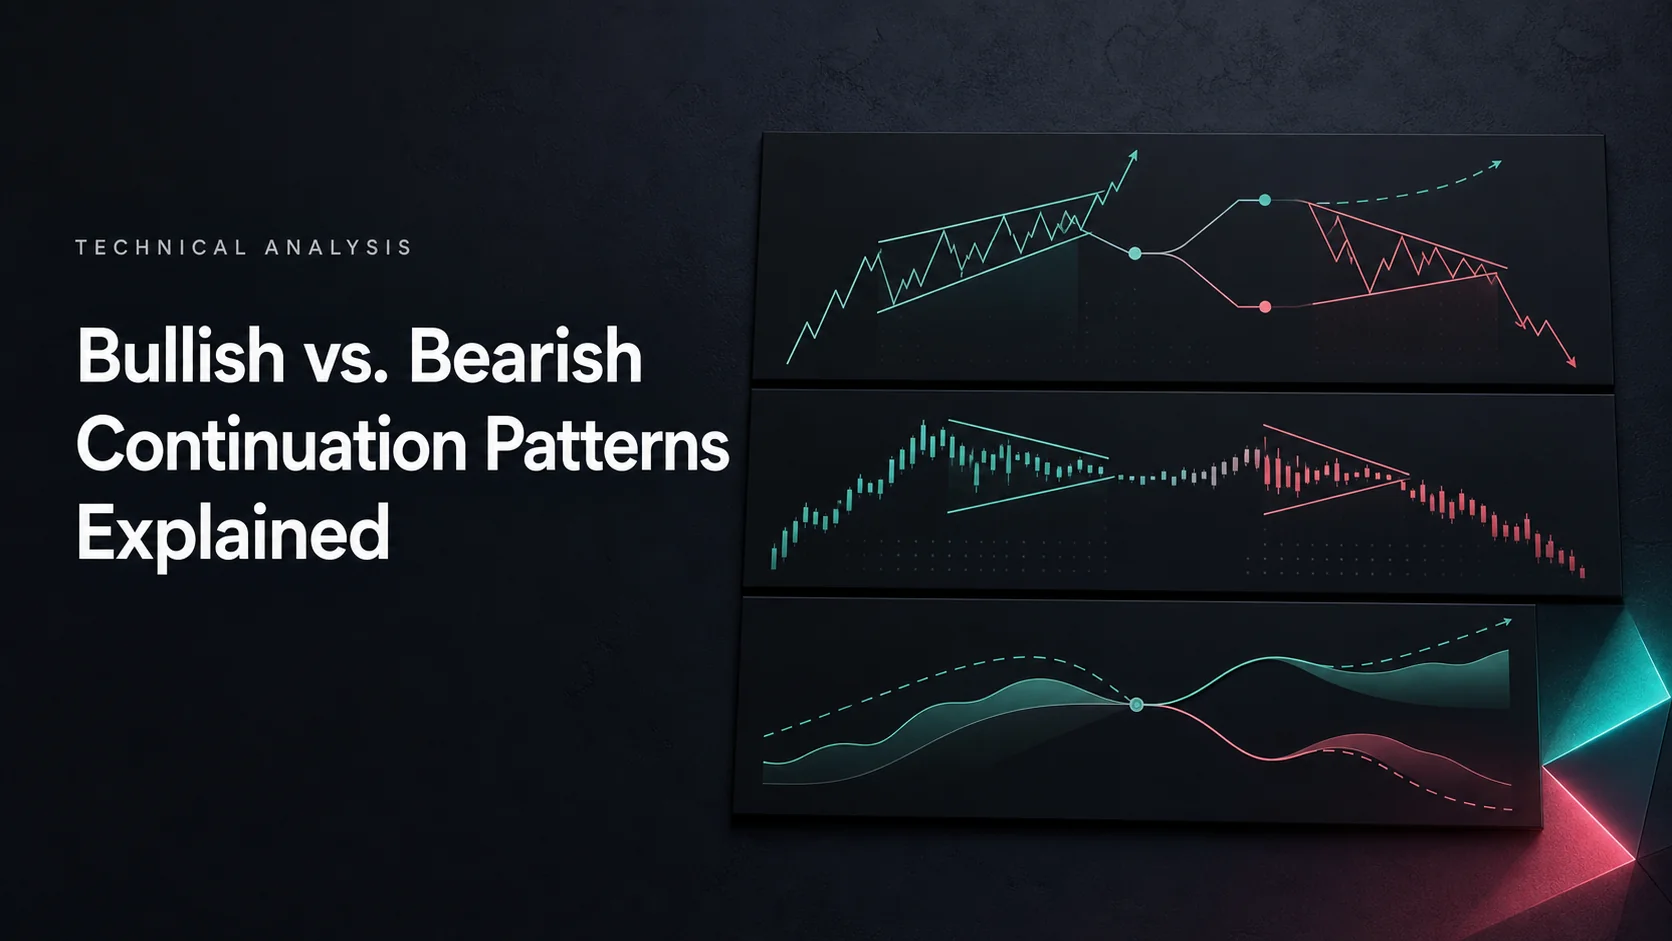
Bullish continuation patterns describe a pause within an advance; bearish continuation patterns describe a pause within a decline. The proposed trade follows the prior direction, but the formation can fail or break the other way. A pattern is a hypothesis to define and test, not a promise that the trend will resume.
Flags, pennants and directional triangles share a consolidation phase, yet their geometry and target conventions differ. Read the prior trend, mark the boundaries consistently and decide what constitutes a breakout before placing an order. Volume can be an additional filter; it cannot certify the outcome.
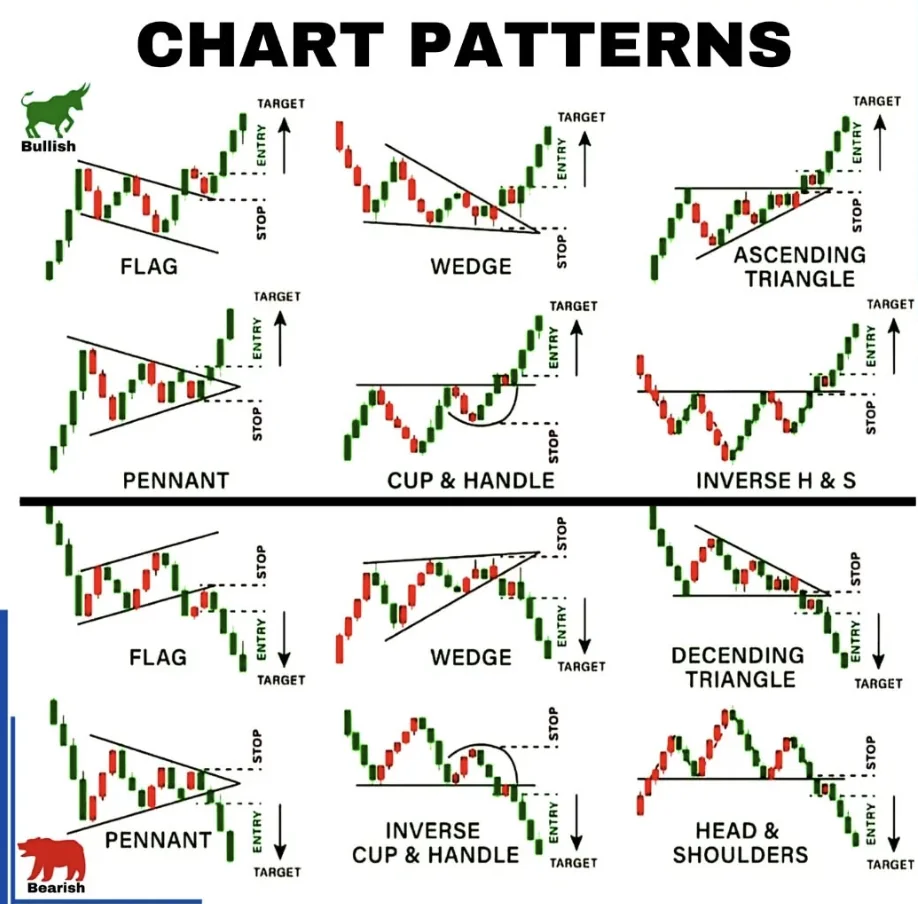
Bullish and Bearish Patterns at a Glance
| Characteristic | Bullish continuation hypothesis | Bearish continuation hypothesis |
|---|---|---|
| Prior context | An established advance | An established decline |
| Flag | A compact channel, often sloping downward against the advance | A compact channel, often sloping upward against the decline |
| Pennant | Converging boundaries after an upward impulse | Converging boundaries after a downward impulse |
| Directional triangle | Ascending triangle: similar highs and rising lows | Descending triangle: similar lows and falling highs |
| Proposed trigger | Defined break above the relevant upper boundary | Defined break below the relevant lower boundary |
| Failure risk | Downside break or failed upside breakout | Upside break or failed downside breakout |
Higher lows and a flat top describe an ascending triangle, not every bullish continuation formation. A bullish flag can have falling highs and lows during its pause. Similarly, a bearish flag can rise during a broader decline. Separate the direction of the consolidation from the direction of the preceding move.
Recognize the Three Main Pattern Families
Flags: A Compact Channel After an Impulse
The StockCharts flag and pennant reference distinguishes the sharp preceding move, or flagpole, from the smaller consolidation. A flag has roughly parallel boundaries, commonly tilted against that preceding move. Without an identifiable impulse, a small channel alone does not establish a flag continuation setup.
For a bullish flag, define the upper boundary that price must clear. For a bearish flag, define the lower boundary that price must break. Specify your anchors, permitted slope, duration and maximum retracement. Do not redraw the formation after the outcome to make a failed setup disappear.
Pennants: Converging Boundaries After an Impulse
A pennant compresses between converging boundaries following a sharp move. Its continuation interpretation comes from that prior impulse and a subsequent break in the same direction. A small symmetrical triangle without the impulse is not automatically the same setup.
A pennant is not inherently faster to resolve or more reliable than a flag. Duration depends on the market, interval and definition. In a coded test, state the allowed number of candles and how the pivots become available. A pivot plotted on an earlier candle may only be identifiable after later candles confirm it.
Ascending and Descending Triangles
An ascending triangle combines at least two comparable reaction highs with successively higher reaction lows. A descending triangle combines comparable reaction lows with successively lower reaction highs. Define a tolerance for “comparable” and require distinct reactions rather than counting adjacent candles as separate tests.
Their conventional biases are upward and downward, respectively. To call either a continuation setup, check the preceding trend: an ascending triangle after a decline can instead be studied as a potential reversal. Neither shape prevents an opposite-direction break. A symmetrical triangle has converging boundaries without the same horizontal-edge structure, so avoid assigning its eventual direction in advance.
Use Volume as a Defined Filter
A common pattern-trading convention looks for reduced activity during consolidation and increased activity around the breakout. This applies to bullish and bearish setups; bearish formation does not universally require rising volume throughout the pause. Even a high-volume break can reverse.
Define the comparison, such as completed-bar volume relative to a stated historical baseline, and test whether that filter adds value. Intraday comparisons should account for normal session patterns: the opening period can naturally trade more volume than midday. An unfinished bar should not be compared with a full historical bar without an explicit adjustment.
Confirm what the feed measures. Exchange-traded volume, venue-specific crypto volume and a broker’s tick volume are different inputs. A decline is not evidence that every trade was seller-initiated; each execution has a buyer and a seller. Volume bars measure activity over time, while volume profile distributes activity across price levels. Do not treat them as interchangeable inputs to a breakout test.
Turn the Pattern into a Complete Trade Plan
| Decision | Bullish example | Bearish example |
|---|---|---|
| Entry condition | Completed close above the chosen resistance boundary | Completed close below the chosen support boundary |
| Alternative entry | A separately defined retest or stop-entry rule | A separately defined retest or stop-entry rule |
| Adverse exit | A level where the bullish hypothesis fails | A level where the bearish hypothesis fails |
| Target convention | Relevant height or pole projection, then an explicit exit rule | Relevant height or pole projection, then an explicit exit rule |
| Execution check | Spread, slippage, order type and available size | The same checks, plus applicable shorting and financing constraints |
A close beyond a boundary, an intrabar break and a retest are different strategies. A retest may never occur, and a limit order may not fill. A stop-entry or market order can fill worse than the trigger price. There is no universal requirement to wait for a 3% clearance: a fixed percentage has very different implications across instruments and chart intervals.
A breakout buffer can be expressed in ticks, price percentage or a specified volatility measure, but choose and evaluate it before reviewing the result. More confirmation can delay entry and reduce the remaining distance to a target. Decide when a setup expires and what happens if price returns inside the formation.
Use the Correct Measured-Move Convention
For a triangle, the conventional projection uses the widest vertical distance between its boundaries, applied from the breakout reference. For a flag or pennant, the conventional projection uses the preceding flagpole length. These are different measurements. Neither establishes a probability of reaching the projected price or a universal percentage of the previous move that will be captured.
For illustration, triangle resistance at 100 and an initial low at 90 imply a ten-point height and a conventional upward projection of 110. If a hypothetical long entry fills at 101 and the planned adverse exit is 97, the distance to 110 is nine points against four points of adverse distance: 2.25 times the planned risk before costs. A later entry changes that comparison even when the drawing is unchanged.
Set an actual exit policy rather than assuming the projected price must be reached. Partial exits, a time limit and a trailing exit each change the outcome distribution. A trailing stop can surrender open profit and can fill worse than expected; it does not lock in a guaranteed gain.
Size the Position and Account for Failure
Choose a loss allowance consistent with the account and combined exposure, then calculate position size from the planned adverse distance and value per unit. Commonly quoted 1–2% limits are not suitable for everyone. Stops placed beyond a pattern boundary still need to account for volatility, costs and order behavior.
The example of risking 50 pips to seek 100 pips describes a nominal two-to-one payoff before costs. It does not prove positive expectancy. Losing frequency, realized gains and losses, financing and execution can outweigh the attractive target distance.
A bearish chart setup is also not automatically an executable short trade. Confirm the instrument’s mechanics, borrow availability and fees where relevant. Short positions can be exposed to sharp squeezes, and ordinary short-stock losses are not capped by the initial sale proceeds. Include gaps and combined correlated exposure in the plan.
Review Pattern Detection Without Confusing It with Validation
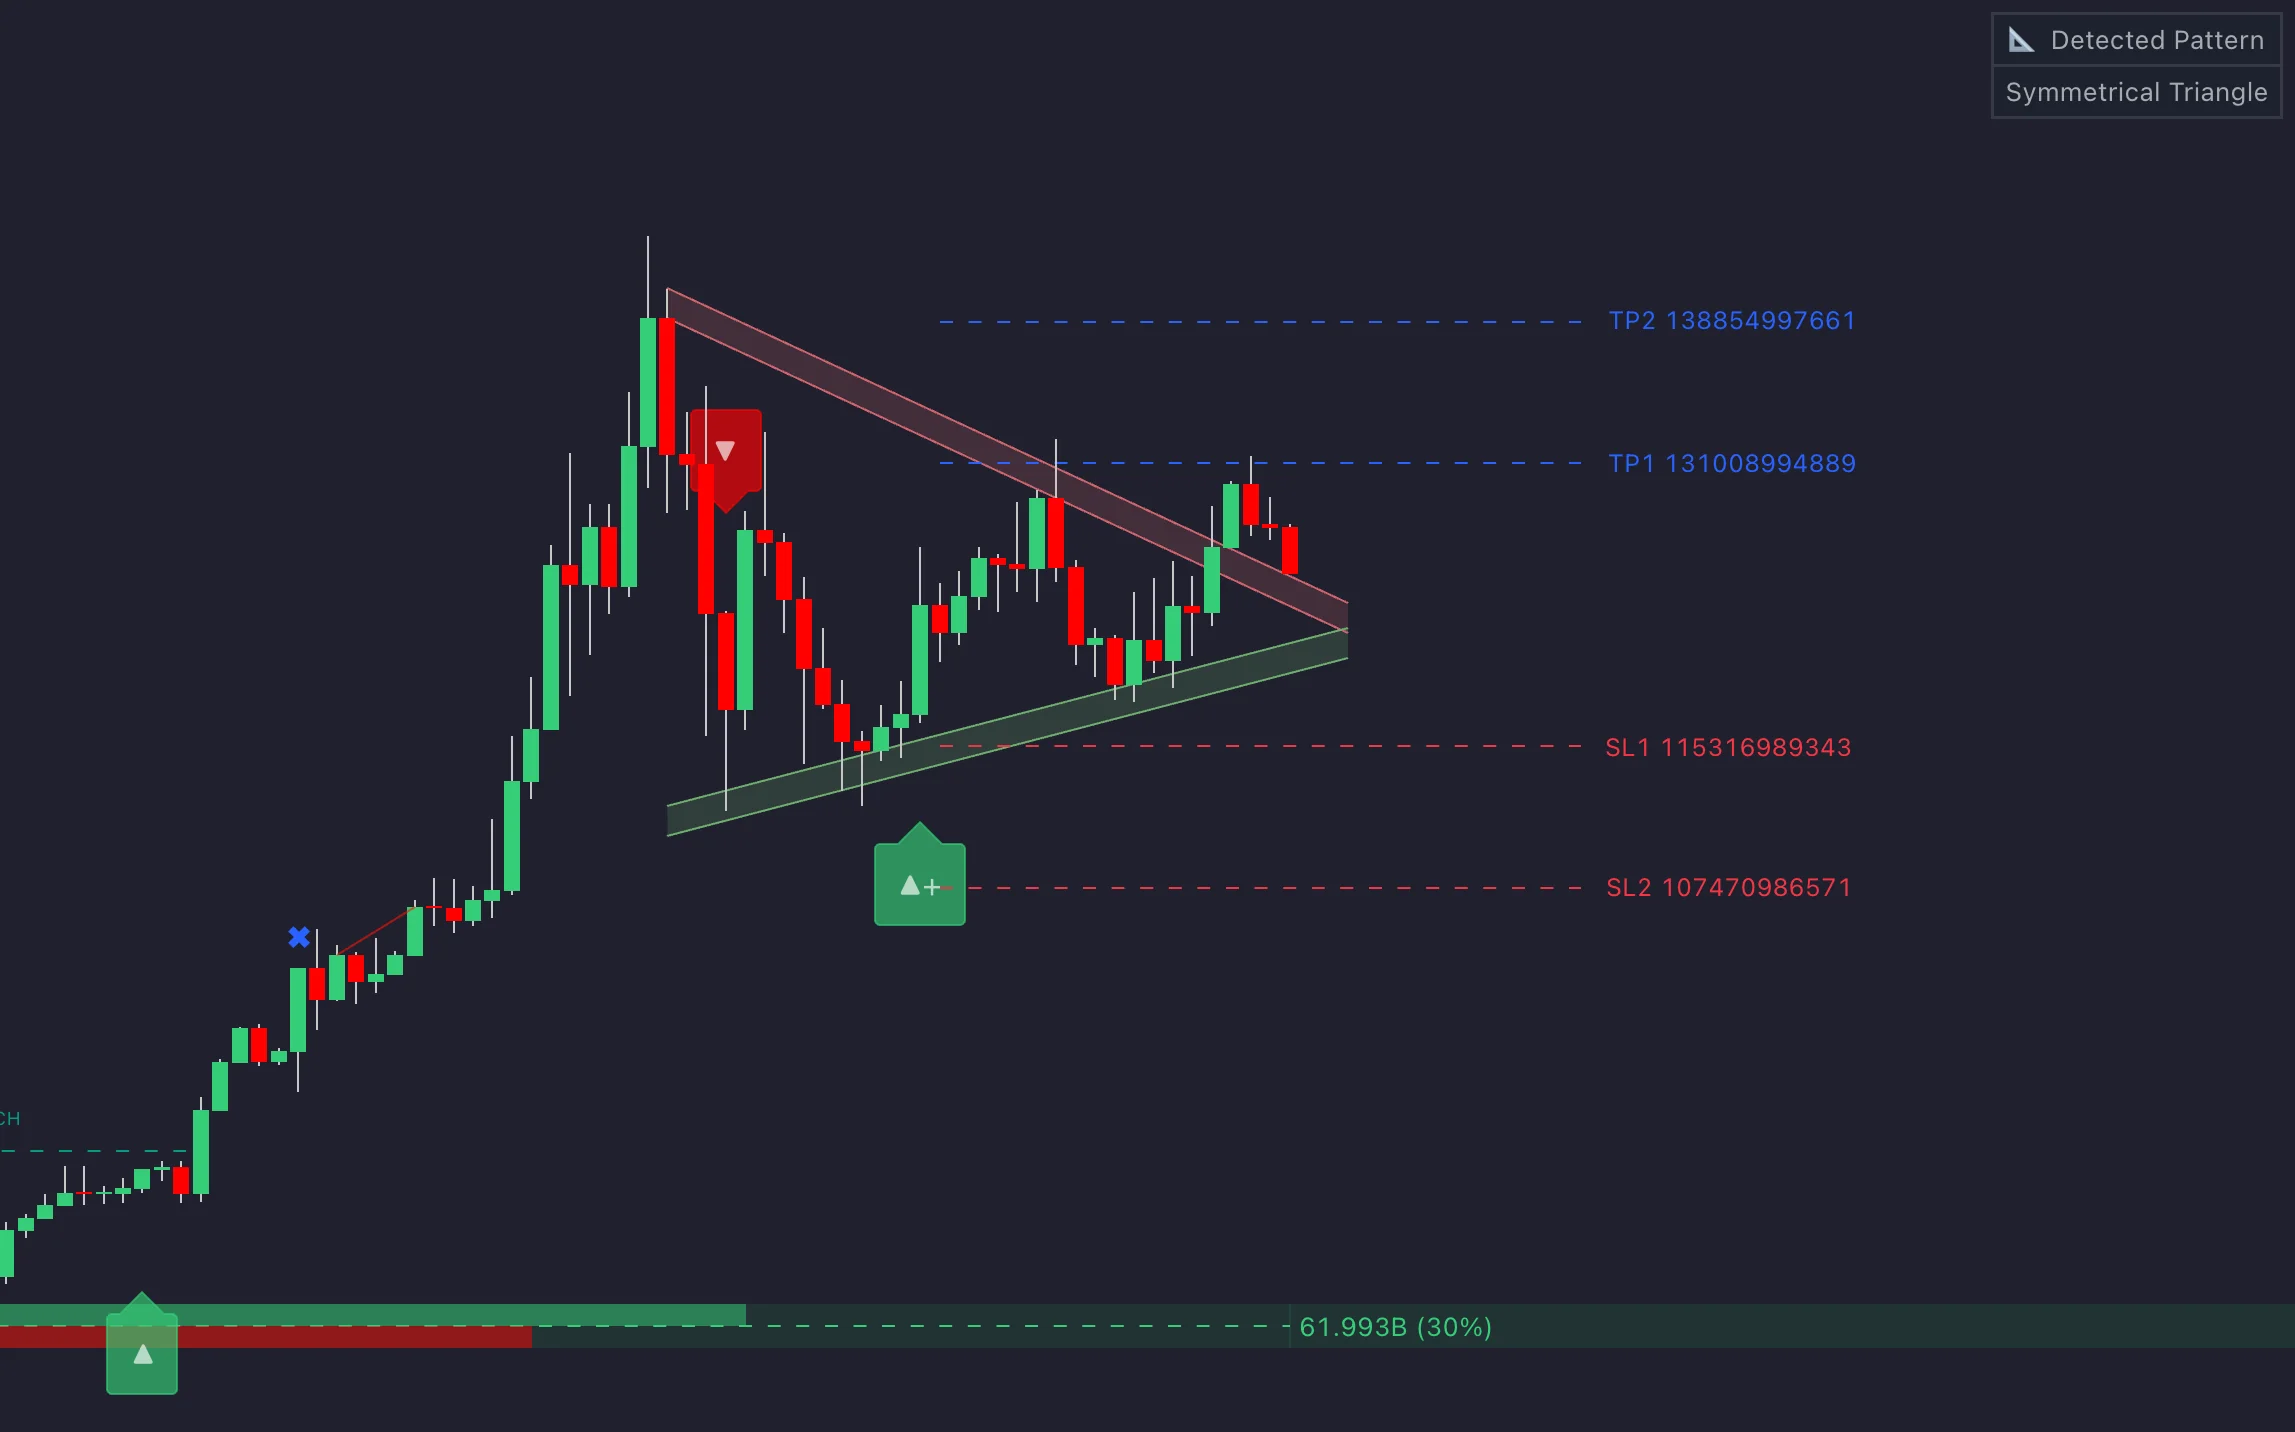
An automatically drawn pattern can save inspection time, but its usefulness depends on its definition and timing. Review the selected anchors, confirmation delay and failure cases. A target overlay is not an executed order, and several indicators based on the same price series are not independent evidence.
Avoid assigning a single success rate to all bullish or bearish continuation patterns. A meaningful study must identify the instrument set, timeframe, sample period, detection rules, entry and exit conditions, costs and definition of success. A breakout frequency is different from a profitable-trade rate, and neither alone establishes expected return.
Research Continuation Rules in LuxAlgo’s Native Platform
Organize the context and setup charts in LuxAlgo’s native workspace. Use matching instruments and sessions when comparing intervals, and check data coverage. An unfinished higher-timeframe candle can change; a completed-bar condition must use the values actually available at the decision time.
Ask Quant, our coding agent to implement a supported version of your rules. Inspect the generated code and run it manually. Verify pivot confirmation, boundary construction, breakout timing and any higher-timeframe inputs. A chart label appearing in hindsight must not become a trade signal before it was knowable.
Use the strategy settings and individual-trade review to assess realistic costs, fills and failures. Keep later evaluation data separate from parameter selection, and retain the original specification when trying a variation. Review net expectancy, drawdown, trade count and exposure rather than optimizing only the win rate.
Frequently Asked Questions
What is the main difference between bullish and bearish continuation patterns?
The prior trend and proposed breakout direction differ. Bullish continuation follows an advance and seeks an upward resolution; bearish continuation follows a decline and seeks a downward resolution. Either hypothesis can fail.
Do all bullish continuation patterns have higher lows?
No. Higher lows are part of an ascending triangle, while a bullish flag can slope downward during the pause. Identify the specific pattern family.
Does higher breakout volume guarantee continuation?
No. Volume can be a defined research filter, but even a high-volume breakout can fail. Check the feed, baseline and timing of the measurement.
How are continuation targets calculated?
Triangle projections commonly use the widest pattern height, while flag and pennant projections commonly use the preceding flagpole. These are planning conventions, not guaranteed destinations.
What success rate should I expect?
There is no universal rate. Results depend on the market, pattern definition, entry and exit rules, costs and sample. Evaluate net outcomes and drawdown on data excluded from setting selection.
Read next