How Consolidation and Triangle Patterns are a Trader's Friend

Triangle patterns describe consolidation between converging price boundaries. They can help organize a trading hypothesis by identifying the range, a possible breakout condition and an invalidation point. The shape alone does not establish which direction price will move or whether a trade will be profitable.
Ascending, descending and symmetrical triangles differ in their boundary slopes. Treat those differences as descriptions to test, rather than promises of a rapid move. The practical task is to define the pattern consistently, wait for the information required by the rule and account for failed breakouts and execution costs.
Recognize the Three Triangle Shapes
| Pattern | Upper boundary | Lower boundary | Interpretation to test |
|---|---|---|---|
| Ascending triangle | Approximately horizontal resistance | Rising support | Compression toward resistance; an upward breakout remains conditional |
| Descending triangle | Falling resistance | Approximately horizontal support | Compression toward support; a downward breakout remains conditional |
| Symmetrical triangle | Falling resistance | Rising support | A narrowing range that can resolve in either direction |
Real charts rarely form perfect geometric shapes. Specify how you select swing points, how much deviation is allowed and how many separate contacts are required. Avoid redrawing boundaries after the outcome just to make a successful example fit. Opposing slopes in a symmetrical triangle do not have to look exactly equal on the screen.
Ascending Triangle: Higher Lows Beneath Resistance
An ascending triangle combines repeated tests of an upper area with rising lows. It is often interpreted as upward pressure, but sellers can continue to hold resistance and price can break below support. A research rule should specify what counts as a breakout and when an entry becomes eligible.
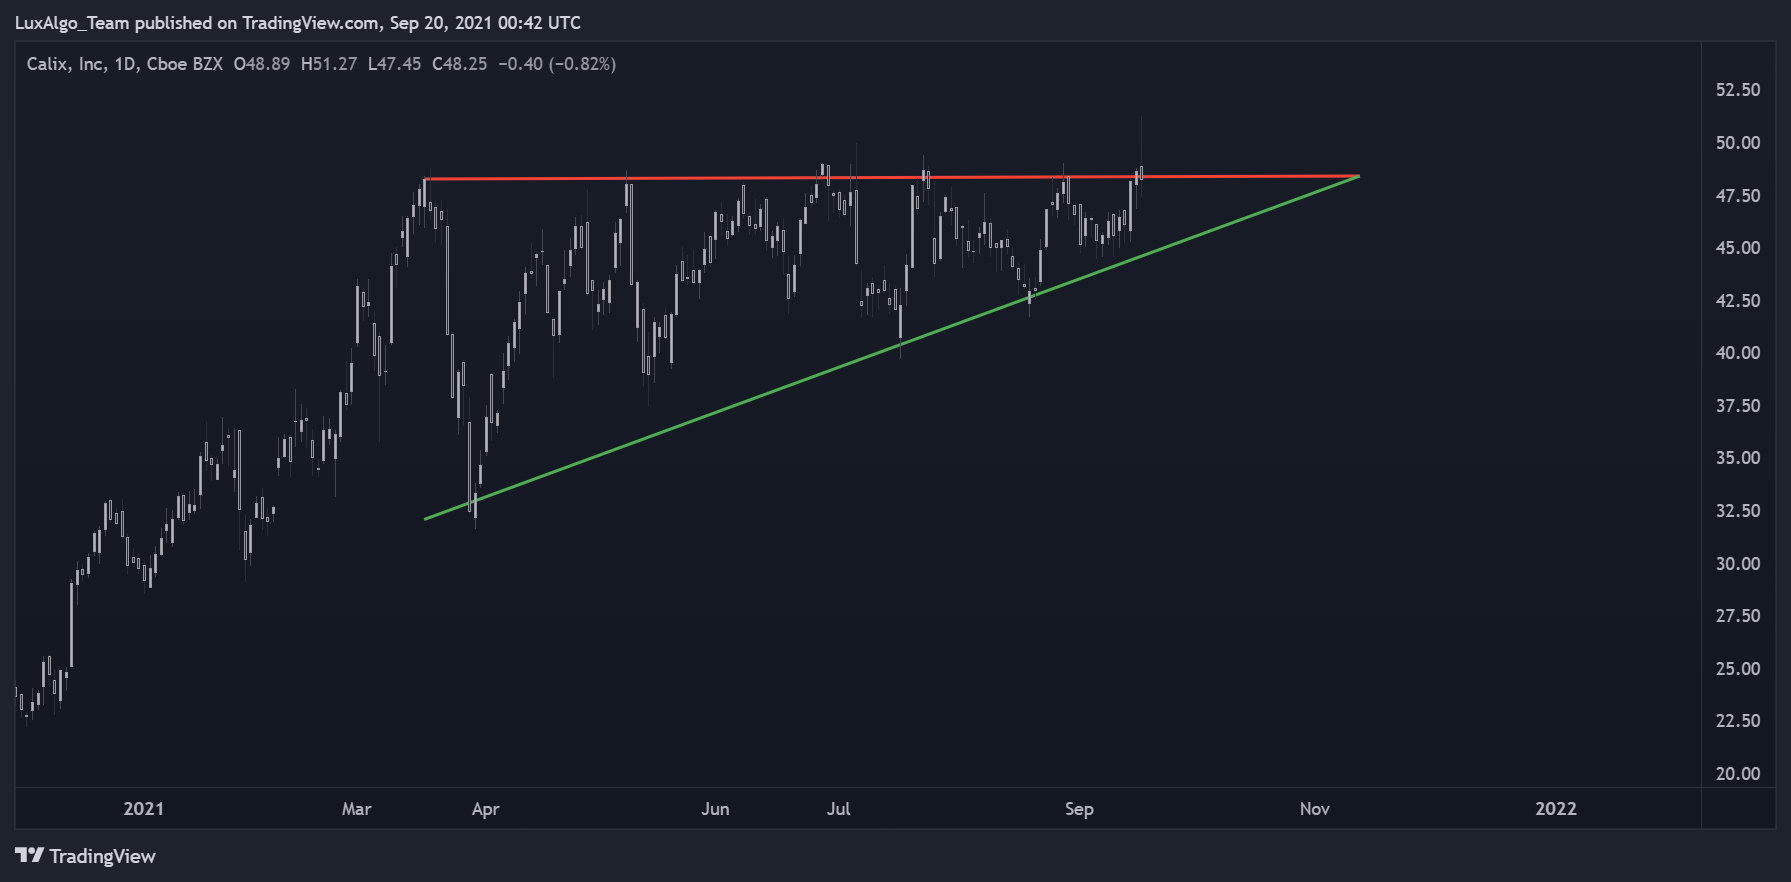
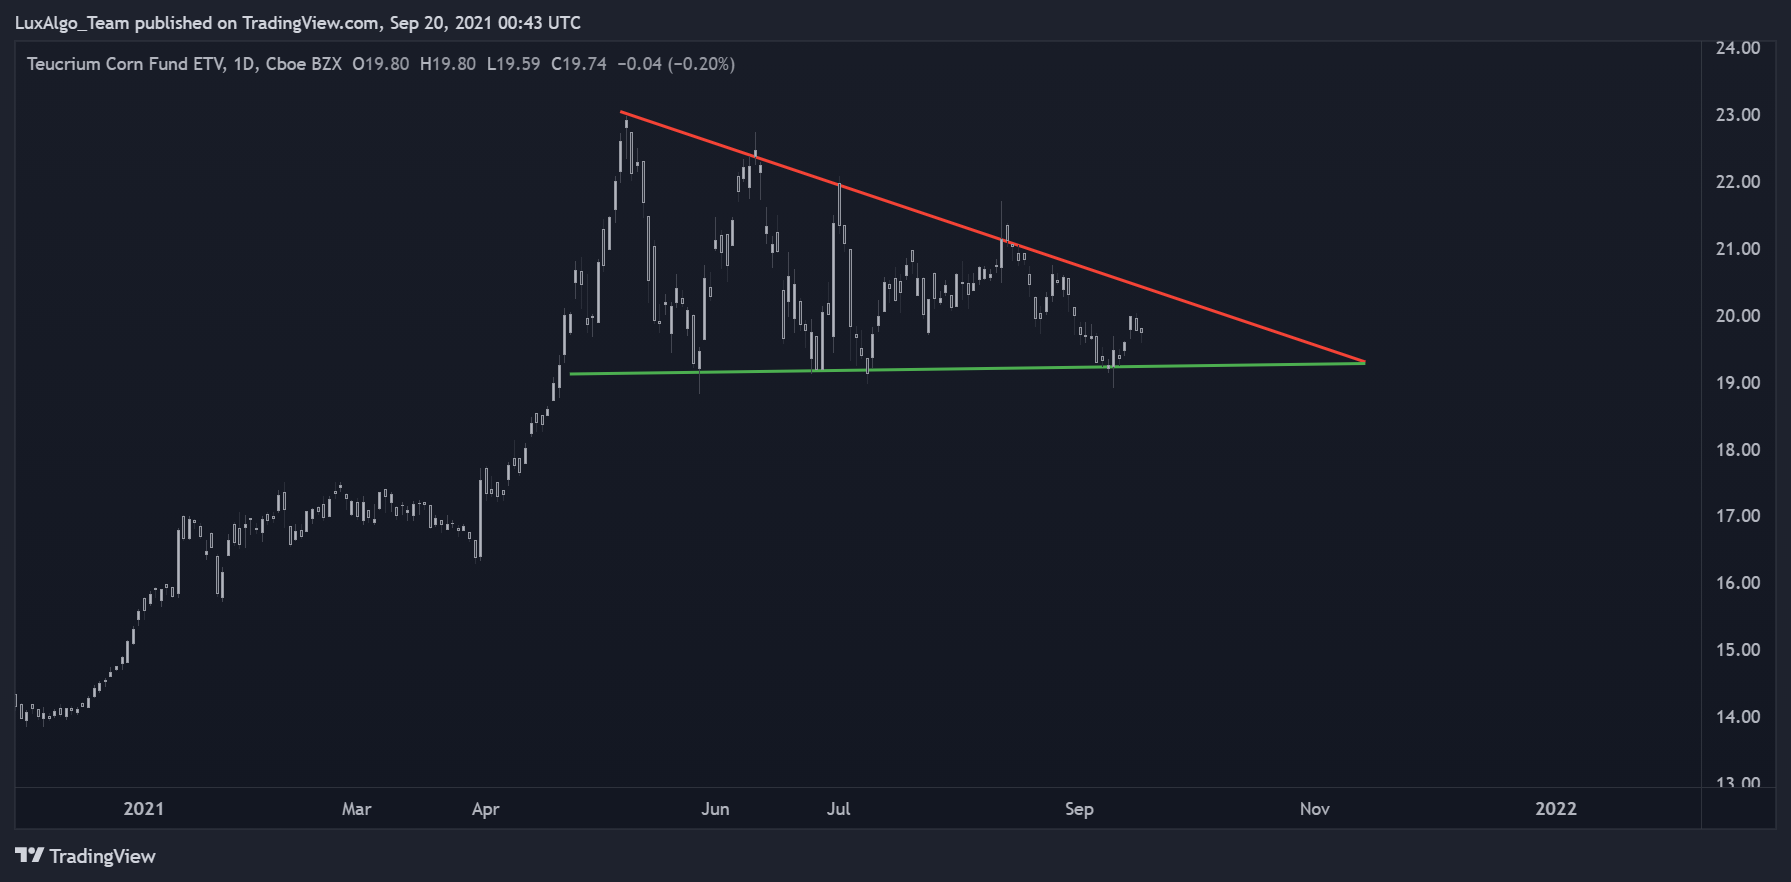
Descending Triangle: Lower Highs Above Support
A descending triangle combines declining highs with a relatively flat lower area. A decline through support is one possible outcome; a move above the upper boundary is another. Distinguish the setup from the event that would confirm the particular trading rule.
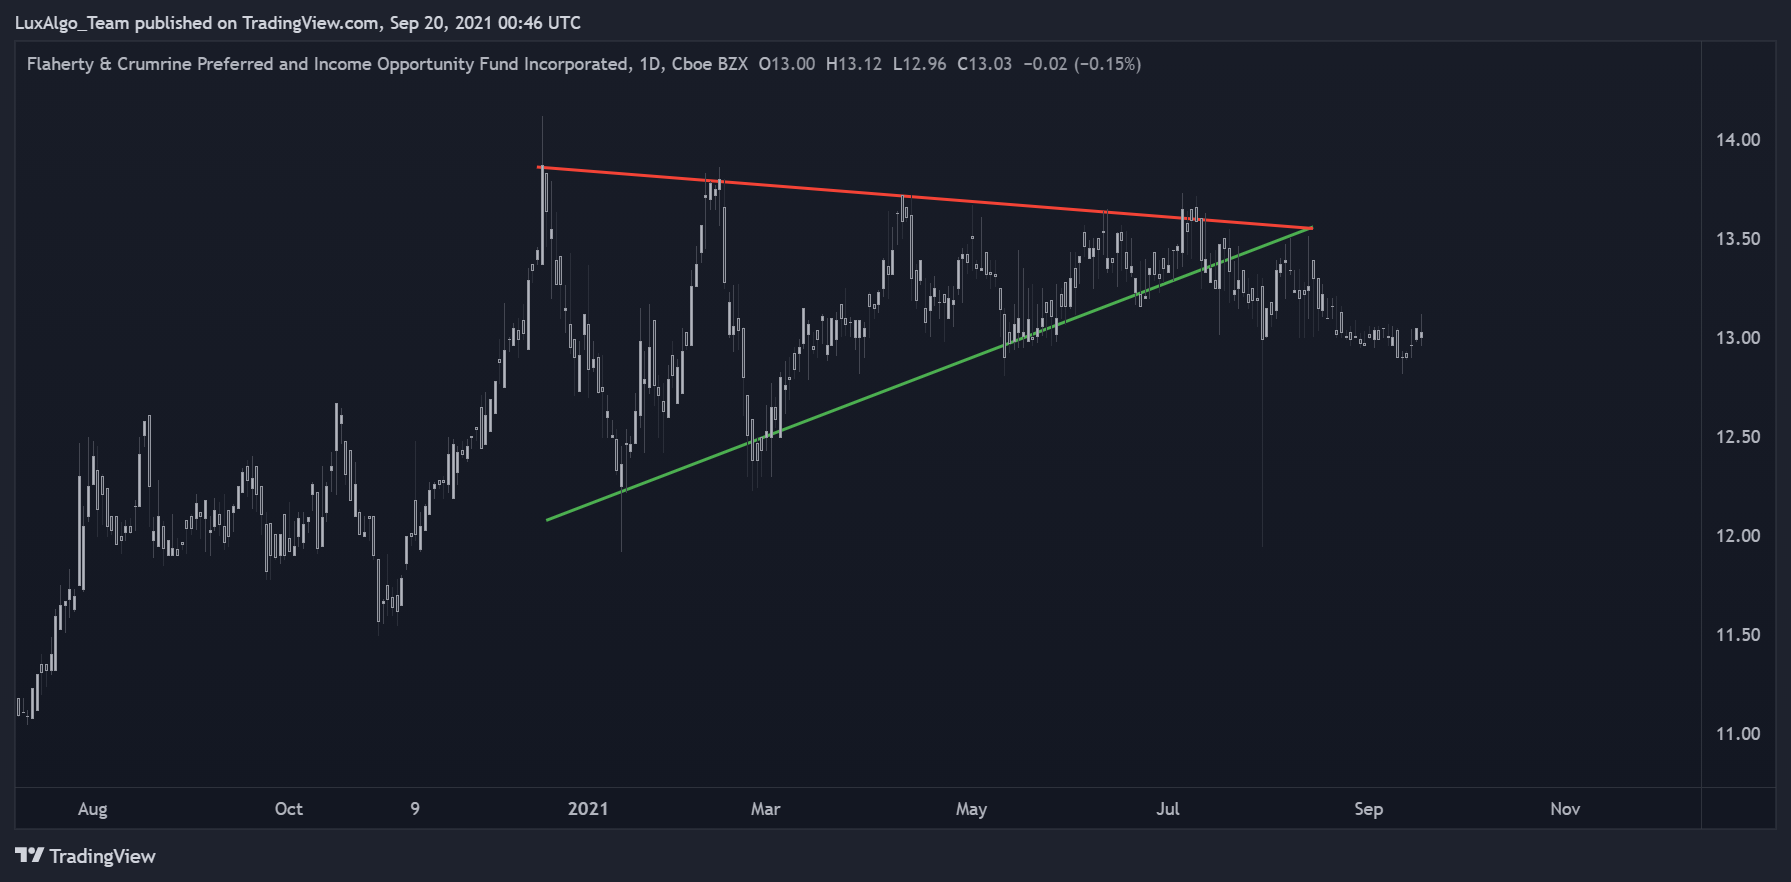
Symmetrical Triangle: Two Converging Boundaries
A symmetrical triangle has lower highs and higher lows. That geometry does not determine the breakout direction. Previous trend, volume and other conditions can be included in a hypothesis, but any claimed improvement needs testing under defined rules.
Define Confirmation Before Looking at the Outcome
A wick through a boundary, a completed close beyond it and a later retest are different events. Choose the event the strategy uses. If the rule requires a completed close, a test cannot enter earlier using knowledge of that eventual close. Requiring a retest can change entry price and cause some moves to be missed; it does not guarantee a successful trade.
- Define the price input, chart interval, swing-point method and boundary tolerance.
- Specify whether a breakout uses an intrabar crossing or a completed close.
- If using a buffer, state its units: price, ticks, percentage or a volatility measure.
- Specify any volume comparison and the history used to calculate it.
- Define the response to re-entry into the triangle, an opposite breakout or expiration of the setup.
Volume may contract during consolidation and increase during a breakout, but this is a condition to examine, not a prerequisite established by the drawing itself. Use the volume actually available for the instrument and feed. A result on one venue’s data need not match a result on consolidated or differently aggregated data.
Confirmed swing points can require later bars. TradingView’s repainting documentation explains why plotting a pivot back on an earlier bar does not mean it was known at that time. Preserve the confirmation delay when testing a pattern-detection rule; Pine implementation details apply to the TradingView workflow.
What Bulkowski’s 5% Failure Definition Means
Thomas Bulkowski’s chart-pattern glossary defines a break-even failure using whether price subsequently moves at least 5% in the breakout direction. That is a retrospective classification used in his pattern research. It is not an instruction to wait until price is 5% beyond a trendline before entering, and it does not establish a universal allowance for present-day trading costs.
An entry buffer is a separate strategy choice. Increasing it can change false signals, entry price, missed trades and the remaining distance to a target. Evaluate those effects together rather than borrowing a research label as an untested execution rule. Pattern statistics also depend on the sample and measurement method; do not transfer a percentage to every market or timeframe without comparable evidence.
Use the Triangle Model as a Description
A simple representation of price inside a narrowing range is y(t) = S(t) + A(t)[R(t) − S(t)] + e(t). Here, S(t) is the lower boundary, R(t) the upper boundary, A(t) a normalized position or oscillation between them, and e(t) a residual measured in price units. For the idealized within-range component, A(t) lies between 0 and 1.
As the width R(t) − S(t) shrinks, the price contribution of a similarly sized normalized oscillation shrinks. A(t) itself does not have to become smaller. If both boundaries are straight lines that converge, their width decreases linearly before their intersection; real price paths and fitted boundaries need not follow that idealization.
This is a descriptive decomposition, not a forecasting equation. Without independently specified methods for the boundaries, oscillation and residual, it can explain a drawing after the fact without predicting the next observation. A dimensionless A(t) should not be directly compared with e(t), which has price units.
The apparent apex angle also changes when a chart is stretched or when axis scales change. It is not an invariant measure of signal quality or proof that noise will overwhelm a pattern at a particular point. Likewise, how price sits relative to a screen-drawn angle bisector is not a universal validity test. Use explicit contact and timing rules instead.
Treat Height Projections as Scenarios
A common triangle convention projects the pattern’s initial height from a defined breakout level. On a linear price scale, the height is an absolute price distance. Adding that distance to an upward breakout or subtracting it from a downward breakout produces a reference level, not an expected return or a guarantee that price will reach it.
| Hypothetical setup | Calculation | Reference level |
|---|---|---|
| Initial upper boundary $50 and lower boundary $44 | Height = $50 − $44 | $6 absolute price distance |
| Upward breakout reference $50 | $50 + $6 | $56 projected level |
| Downward breakout reference $44 | $44 − $6 | $38 projected level |
State which points define the initial height and which price anchors the projection. Copying a percentage from the triangle’s base is not the same as projecting an equal absolute distance from another price. On a logarithmic chart, specify a consistent method rather than treating visual distances as interchangeable with linear price differences.
The projection does not determine a suitable stop, the chance of success or the time required to reach it. Nor does a narrowing triangle imply that the eventual breakout must decline linearly in size as price approaches the apex. Those would be separate claims requiring evidence.
Separate Planned Risk from Actual Loss
For a hypothetical long entry at $50.20 and planned exit trigger at $48.80, the price distance is $1.40 per share. A $140 planned price-risk amount corresponds to 100 shares before fees and slippage. If a gap leads to an exit at $47.50 instead, the price loss is $270 on those shares. The planned amount is not a loss cap.
Investor.gov’s order guide explains that market orders do not guarantee an execution price and limit orders may not execute. A stock stop order becomes a market order when triggered. Check the actual instrument, venue and broker’s order behavior when translating a chart rule into an execution plan.
Review unsuccessful and ambiguous examples as well as attractive breakouts. Include spread, fees, slippage, missed fills and the cost of repeated attempts. A favorable-looking target-to-stop distance alone does not establish positive expectancy; the frequency and size of realized wins and losses matter.
Do Not Infer Participant Intent from the Shape Alone
A narrowing range can arise from many combinations of orders and participation. The chart does not identify who is trading, prove that informed traders are accumulating a position or reveal stored energy that must be released. Such stories may suggest hypotheses, but they are not observations established by converging trendlines.
Keep the distinction between description and explanation. You can measure range contraction and subsequent outcomes under fixed rules without claiming to know the motives of every participant. That makes the idea easier to challenge and reproduce.
Research Triangle Rules in LuxAlgo’s Native Charts
Start in LuxAlgo’s native charts with a specific instrument, timeframe and pattern definition. Separate the chart used to develop the idea from a later period used to evaluate the selected rule. Keep failed and expired setups in the record rather than retaining only completed breakouts.
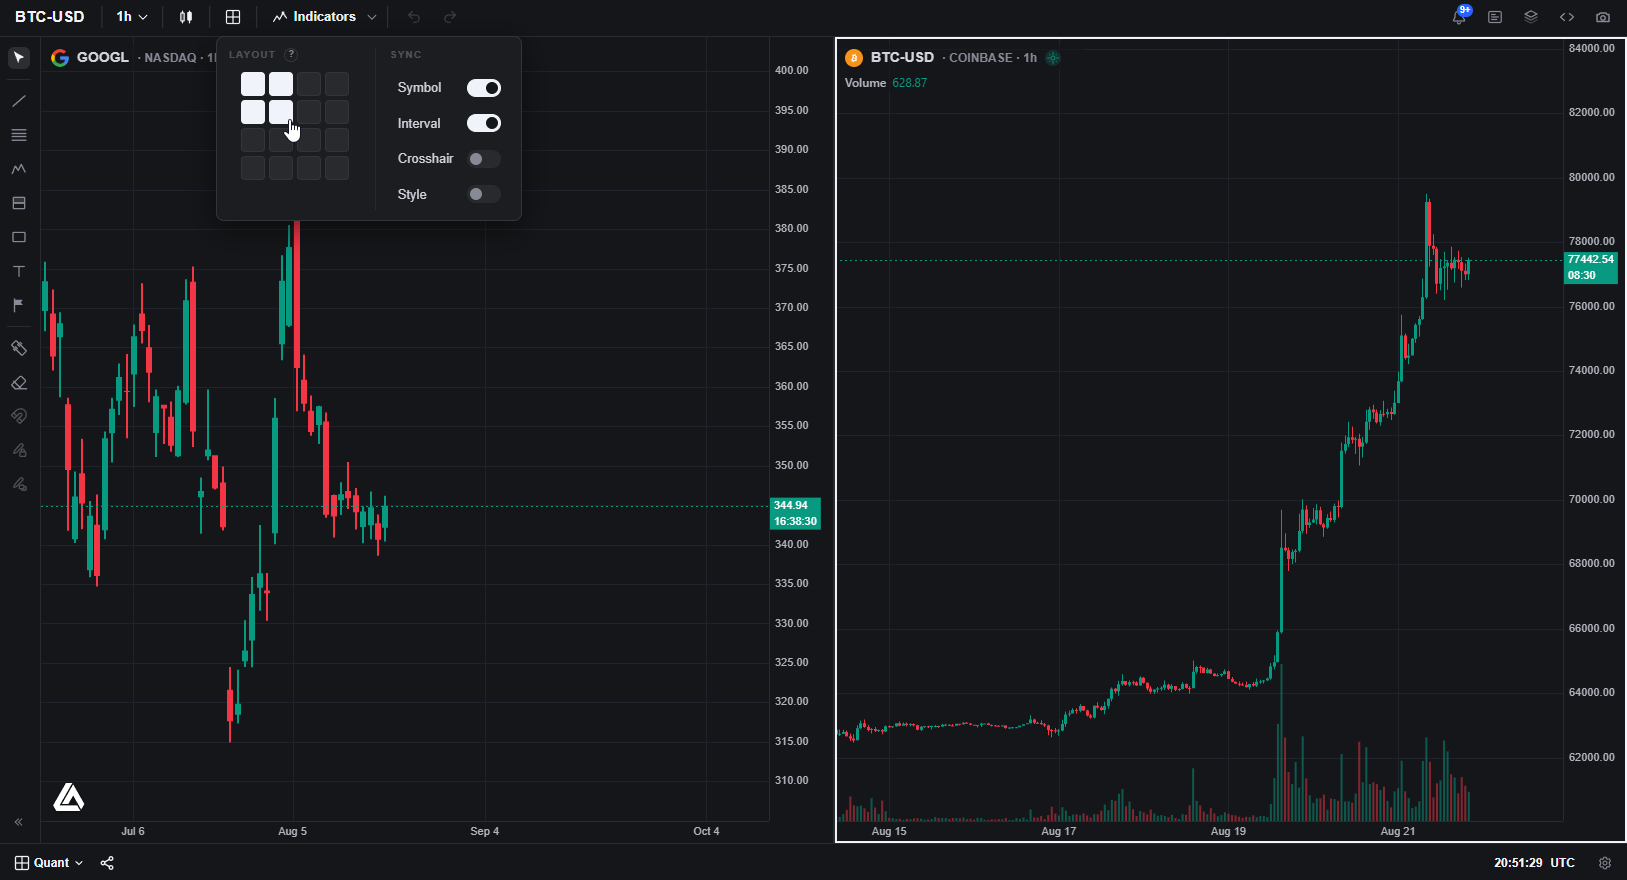
Ask Quant, our coding agent to help express a supported strategy hypothesis with explicit swing confirmation, breakout, exit and sizing conditions. Inspect the generated code and run it manually. Review strategy settings, costs and individual trades to check whether the implementation matches the intended rule.
Check native data coverage and available history before comparing outcomes. The documented US-equity source is Cboe EDGX rather than a consolidated all-venue feed. Changing symbols, intervals or assumptions changes the experiment and requires another run.
LuxAlgo’s TradingView toolkits are separate from native charts. The legacy Backtesting Assistant is also distinct from the current native strategy workflow. Use the documentation for the platform and tool actually being tested.
Frequently Asked Questions
What is a triangle pattern in trading?
It is a consolidation described by converging upper and lower price boundaries. The geometry helps define a hypothesis but does not establish the breakout direction or profitability.
Are ascending triangles always bullish?
No. Rising support beneath relatively flat resistance can support an upward-breakout hypothesis, but price can remain in the range or break downward. Define and test the confirmation rule.
Should I wait for a 5% breakout before entering?
Bulkowski’s 5% break-even failure definition is a retrospective research classification, not a universal entry rule. Any entry buffer requires separate testing with costs and timing assumptions.
Does a triangle height projection guarantee a target?
No. Adding or subtracting the initial absolute height from a defined breakout level creates a reference scenario. It does not establish the probability, timing or realized size of a move.
How can LuxAlgo help research triangle strategies?
Use native charts and Quant to express a supported rule with explicit confirmation, exits and sizing. Inspect generated code and run it manually, then review costs, individual trades and a later evaluation period.
Read next