Hybrid Trading: Combine Active & Long-Term

Hybrid trading combines an active trading allocation with investments held for longer-term goals. Each part needs its own purpose, rules and performance record. Using two holding periods does not automatically diversify a portfolio or produce steadier returns: both allocations can lose money at the same time.
The practical benefit is organization. You can test short-term ideas without letting each market move rewrite the long-term plan. Fundamental research can inform what to own, while technical analysis can help define when an active position starts or ends. Neither approach guarantees an advantage.
- Separate objectives: distinguish an investment thesis from a short-term trading setup.
- Set capital limits: specify how much belongs to each allocation and how transfers work.
- Measure total exposure: different accounts or timeframes can still hold the same underlying risk.
- Evaluate results after costs: include fees, slippage, taxes where applicable and the time spent trading.
Creating Your Hybrid Strategy
Setting Goals and Risk Limits
Begin with the purpose of the money, when it will be needed and the losses you can afford. Investor.gov’s allocation guidance emphasizes investment horizon and risk tolerance. A target return is not a risk control, and needing a certain return does not make a strategy capable of earning it.
Use process goals: document every active trade, test a defined rule before using it, keep exposure within the plan, and review whether active decisions add value. Avoid building expenses around a promised monthly trading income. Even 2% compounded every month would imply about 26.8% annually; 3% would imply about 42.6%, before costs and taxes. Those are arithmetic illustrations, not reasonable default forecasts.
Write down the maximum active allocation, planned loss per trade, aggregate open risk, and conditions for pausing. These limits should reflect financial capacity as well as emotional comfort. A trader who remains calm during a loss can still be taking more risk than their savings plan can support.
Dividing Trading Capital
Here is one hypothetical $50,000 structure. It demonstrates accounting boundaries, not a recommended allocation. The appropriate mix may include no active trading at all.
| Component | Illustrative amount | Purpose and boundary |
|---|---|---|
| Long-term investments | $35,000 / 70% | Hold according to a written investment plan; losses remain possible |
| Active trading | $10,000 / 20% | Use explicit entry, exit and sizing rules; no automatic replenishment after losses |
| Cash allocation | $5,000 / 10% | Maintain planned liquidity; consider inflation and account terms |
Personal emergency savings and near-term spending needs should be considered separately when deciding how much is available to invest. Money assigned to the long-term component is not an unlimited rescue fund for losing trades.
Choose a review schedule or allocation threshold for rebalancing. New contributions can sometimes restore weights without selling. Moving money between components is a transfer, not an investment return. Track transfers explicitly so adding cash does not make a weak trading record appear profitable.
Selecting Markets to Trade
For active trades, inspect the bid-ask spread, available liquidity, volatility, trading hours and the ability to obtain reliable data. High volume alone does not guarantee a good fill. For long-term holdings, consider diversification, costs, the underlying business or fund mandate, and whether the exposure fits the goal.
A long-term technology fund plus short-term trades in its largest holdings can increase the same sector exposure. Look through fund holdings and compare economic drivers. Different tickers and different holding periods are not proof of independent risk.
Tax treatment depends on jurisdiction, account and instrument. For U.S. federal taxation of ordinary investment assets, the IRS generally distinguishes holdings of more than one year from one year or less. Net short-term capital gains are taxed at ordinary income rates; most net long-term capital gains use 0%, 15% or 20% rates depending on taxable income, with exceptions and possible additional taxes. A fixed “20–35% short-term rate” is not a reliable rule. Account separation does not by itself eliminate tax interactions.
Short-Term Trading Methods
Finding Trading Setups
Start with one or two setups that can be described precisely. Labels such as breakout or reversal do not have universal win rates. Results depend on the instrument, period, filters, execution, costs and how winning and losing trades are defined.
| Setup family | Rules to specify | Common failure to examine |
|---|---|---|
| Breakout | Lookback level, completed-bar confirmation, entry and invalidation | Price returns inside the prior range after entry |
| Support or resistance reaction | How levels are identified before the trade and what counts as a reaction | The level fails or was selected only with hindsight |
| Moving-average crossover | Lengths, price input, signal timing and exit | Repeated small losses during sideways markets |
Volume and broader market context can become testable filters. Adding more indicators does not independently validate a setup, especially when several summarize the same prices. Test whether a filter improves the result after costs rather than accepting visual agreement as proof.
Using Technical Indicators
Moving averages smooth past prices and therefore lag. A shorter average crossing above a longer one can define a trend-following rule, but it is not a prediction. Choose lengths for a specific hypothesis and assess how sensitive the result is to nearby settings.
RSI describes recent momentum. Traditional 30 and 70 levels can label relatively weak or strong momentum, but a strong trend can keep RSI near an extreme. An “oversold” reading alone is not an instruction to buy. Bollinger Bands commonly use a 20-period average with bands two standard deviations away; touching a band does not guarantee a reversal or a fixed statistical probability for future prices.
Managing Short-Term Risk
Define whether a risk percentage refers to trading capital or the whole portfolio. In the example above, 1% of the $10,000 trading allocation is $100, while 1% of the $50,000 portfolio is $500. Confusing the denominator creates five times the planned exposure.
For a hypothetical long trade at $50 with a planned exit at $48, a $100 loss budget implies 50 shares before costs: $100 ÷ $2. The position value is $2,500. If a gap instead produces an exit at $45, the loss becomes $250. As the SEC explains, a stop price does not guarantee the execution price; a stop-limit order can remain unfilled.
Choose an invalidation level appropriate to the setup and volatility, then size the trade. A universal stop 10–15% below every breakout has no sound basis. Review simultaneous positions too: three correlated trades each risking $100 are not necessarily three independent bets.
Losses also change recovery arithmetic. A 10% decline requires about an 11.1% gain to recover; a 95% decline requires 1,900%. These identities explain why controlling large losses matters. They do not establish that a chosen stop or daily limit can prevent every gap or execution problem.
Long-Term Investment Methods
Company Analysis Basics
For an individual company, examine the business model, competitive position, management decisions and financing needs alongside the financial statements. A compelling product can still be an expensive investment at the wrong price.
Useful questions include whether margins are durable, earnings turn into cash, debt is serviceable and share issuance dilutes owners. Return on equity can be boosted by leverage; a high current ratio is not equally meaningful across industries; a low price-to-earnings ratio can reflect deteriorating expectations. Compare ratios with appropriate peers and read the underlying accounting notes.
For a fund, review its mandate, holdings, fees and concentration. A broadly diversified fund and a narrow thematic fund serve different purposes. “Long-term” describes the intended horizon, not a guarantee of stability.
Regular Investment Planning
Dollar-cost averaging means investing equal amounts at regular intervals. It makes purchase timing systematic and buys more units when prices are lower, but it does not guarantee a profit or protect a failing investment.
For example, $500 invested at $50 buys 10 shares; another $500 at $40 buys 12.5 shares, assuming fractional shares and no fees. The average cost is about $44.44 across 22.5 shares. At $40, the holding is worth $900, so the investor is still down $100. A lower average cost is not the same as eliminating losses.
If the entire amount is already available, spreading its investment over time also means keeping some cash uninvested. FINRA discusses that trade-off: reduced timing exposure can come with missed gains during rising markets. Distinguish staged investment of existing cash from regular investing as income arrives.
Portfolio Management
Set a workable review rhythm: check weights periodically, read new financial reports when released, and reconsider the overall plan when goals or cash needs change. Review does not require constant trading. Rebalancing and sales can create costs and taxes, so evaluate the net effect.
Combining the Two Approaches
Give each timeframe a job. A weekly or daily chart may describe broad context; a shorter chart may define an active entry. Lower timeframes do not “perfect” timing. If a rule uses higher-timeframe data, ensure that it uses only information available when the signal occurs, including whether that bar has closed.
Keep active-trade exits separate from investment-thesis reviews. Do not reclassify a failed short-term trade as a long-term investment merely to avoid recognizing a loss. Conversely, a minor intraday fluctuation should not automatically overturn an investment plan built around multi-year cash flows.
Transfers of trading profits can follow a scheduled rule after costs and applicable tax reserves. Do not assume profits will arrive every month or increase trade size to meet a transfer target. Seasonal patterns are research hypotheses, not dependable reasons to raise exposure.
Evaluate the combined account as well as both components. If $35,000 of investments gains 5%, the $10,000 trading allocation loses 10%, and $5,000 cash is unchanged, the net result is $750: $1,750 minus $1,000. That is 1.5% on the original $50,000 before costs and taxes. Quoting only the investment gain would conceal the drag from trading.
Video: Combining Fundamental and Technical Analysis
This Financial Wisdom video discusses using business research alongside chart analysis for swing trading. It illustrates one approach, rather than proving that combined analysis produces superior returns. Treat historical examples and promotional claims as material to examine critically.
Trading Software and Tools
Choosing a Broker and Research Tools
Separate custody and execution from research. Compare account eligibility, asset access, order handling, reports, costs, security and support. Platform features do not establish that a strategy will be profitable.
- Interactive Brokers provides access to multiple markets and asset classes. Verify the instruments and permissions available to your account; countries served and trading venues are different measures.
- Fidelity Trader+ provides desktop, web and mobile trading tools. Check the workflows and account services relevant to both planned investing and active orders.
- Power E*TRADE offers trading platforms across desktop, web and mobile. Assess order entry and reporting using the current platform documentation.
A LuxAlgo Research Workflow
Use LuxAlgo charts to inspect the relevant symbols and timeframes. A multi-chart layout can keep different views visible while you compare context with an active setup. Check symbol, session and interval instead of assuming every chart uses the same data.
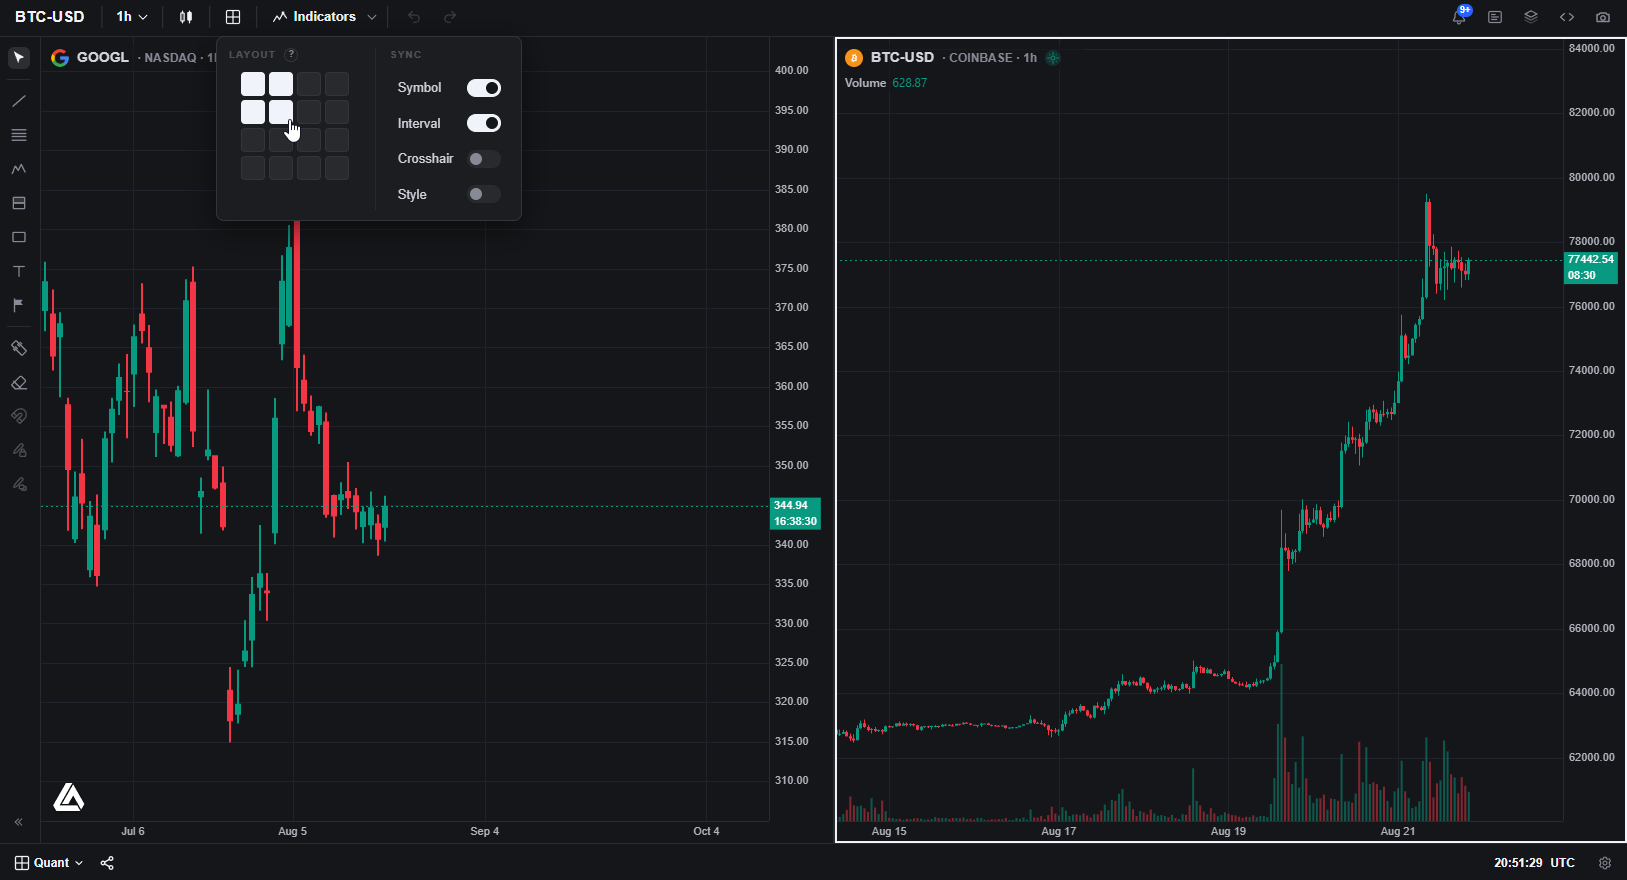
Ask Quant, our coding agent, to implement an explicit rule for the active component. Specify completed-bar signals, entries, exits and position sizing. Review the generated code, run it on the intended chart, and configure capital, commission and slippage. Successful execution of code is not independent validation of the trading idea.
Inspect the backtest summary and Trades Log rather than only net profit. Consider drawdown, losing sequences, costs and sensitivity to settings. Reserve an untouched period for evaluation. A daily-chart test and an intraday test involve different opportunities and costs; neither simulates an entire hybrid portfolio by itself.
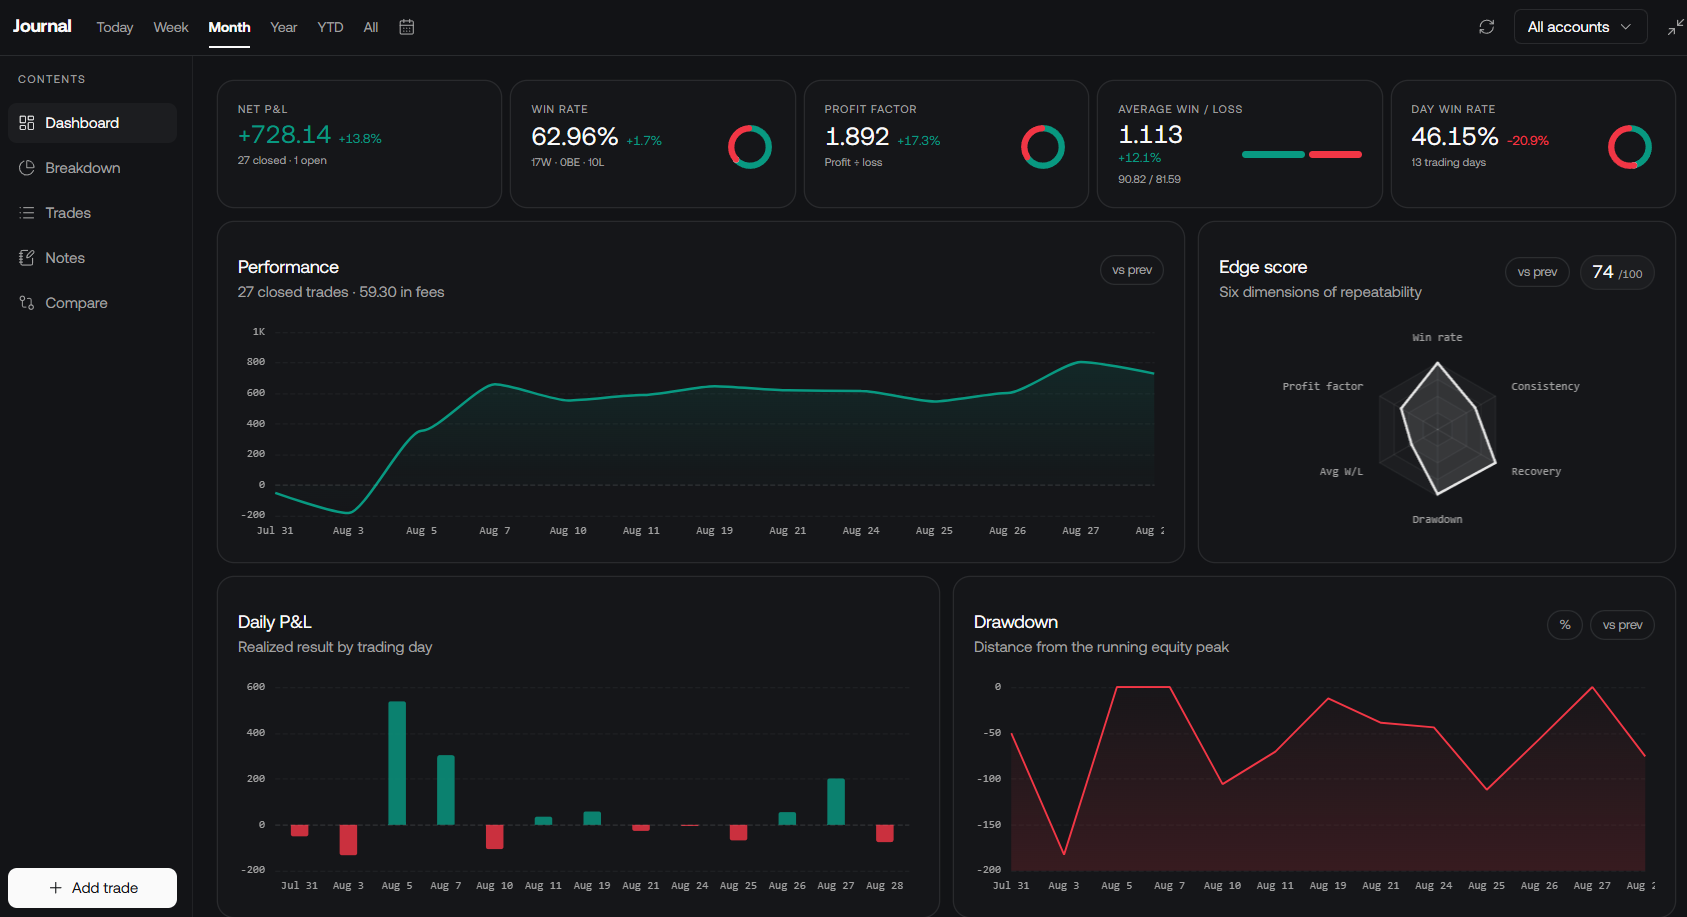
Use the LuxAlgo Journal to review recorded trades and notes. Keep the active strategy’s results distinct from investment contributions and withdrawals, and maintain an overall portfolio record. This makes it easier to decide whether the trading component earns its place after costs and effort.
Getting Started
Write the capital split, entry and exit rules, review schedule and transfer policy before adding complexity. Begin with a research or practice record, compare the active component with a suitable passive alternative, and retain it only if the evidence supports its role. A hybrid approach is useful when both components serve a clear purpose and the combined risk remains appropriate for the person funding it.
Read next