Multi-Timeframe Fibonacci Levels Explained
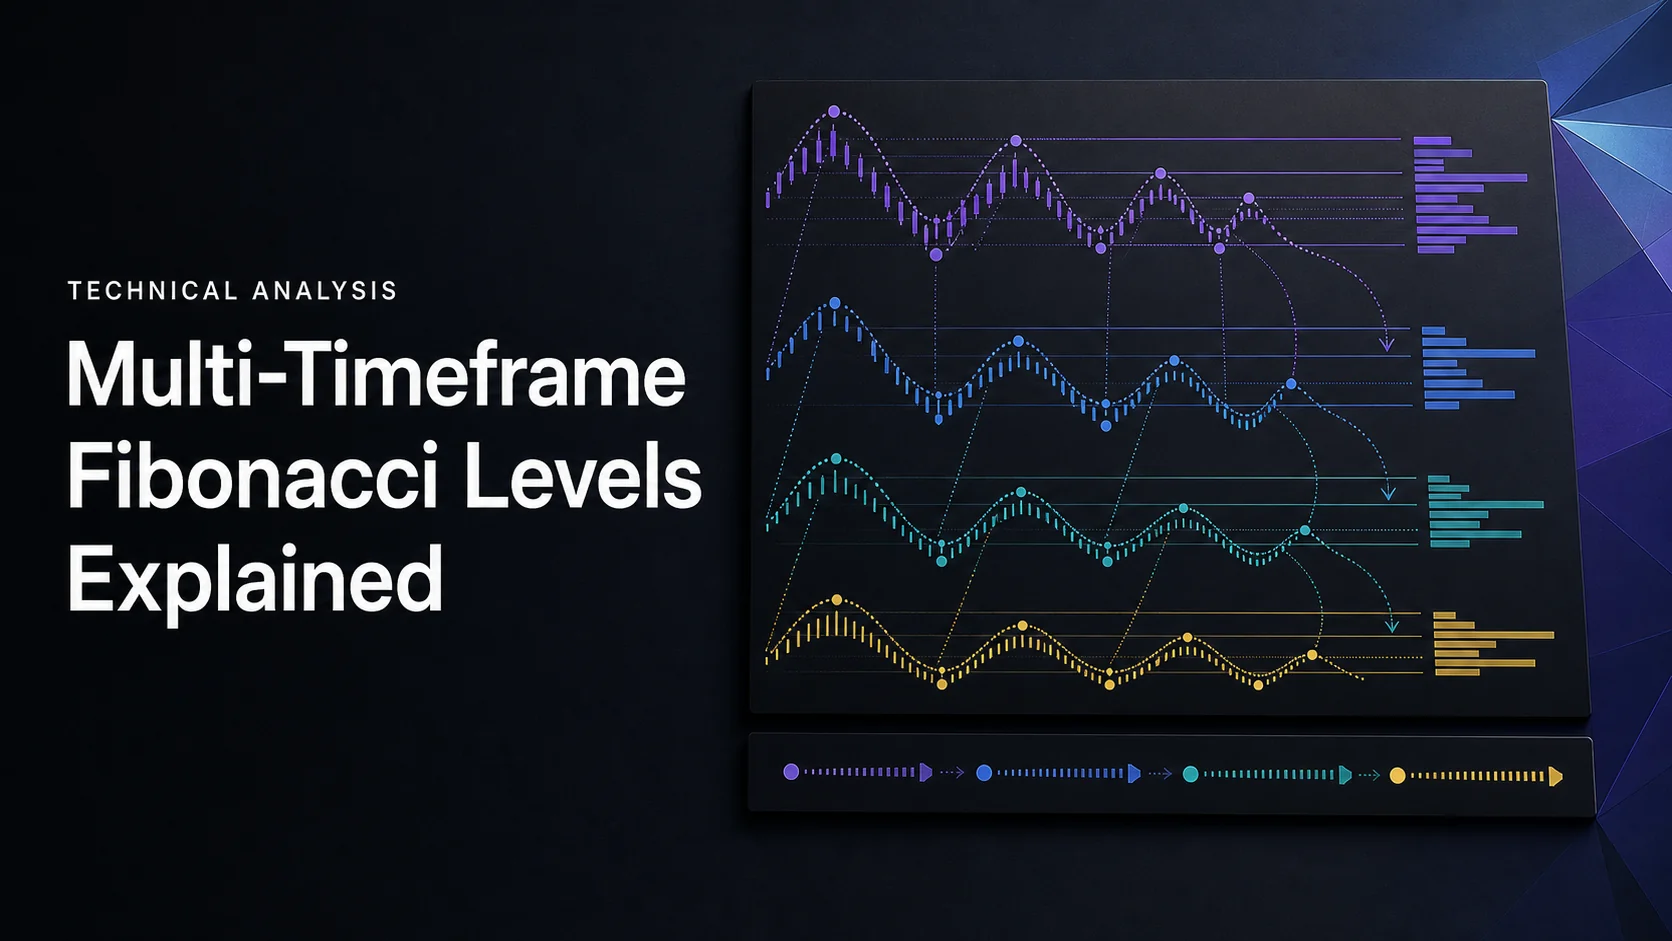
Multi-timeframe Fibonacci analysis compares levels derived from different, explicitly chosen price swings. It can organize a trading hypothesis, but overlapping lines do not establish a reversal probability. The anchors, calculation convention and time at which each swing became known determine whether the comparison is meaningful.
Changing a chart from hourly to daily without changing its price anchors does not create a new Fibonacci measurement. Start with a broader swing for context, identify a separate smaller swing when appropriate, then define what price must do at the resulting zone before a trade becomes eligible.
Calculate the Levels Before Looking for Confluence
Fibonacci retracement tools place reference levels between two price anchors. Common ratios include 23.6%, 38.2%, 61.8% and 78.6%. The 50% midpoint is also widely used, although it is not a Fibonacci-sequence ratio. IG’s retracement explanation distinguishes that midpoint and illustrates subtracting a fraction of a completed rise from its high.
For the linear-price examples here, let L be the low, H the high and r the retracement fraction. After a rise from L to H, the pullback level is H − r × (H − L). After a fall from H to L, the rebound level is L + r × (H − L). The percentage measures how much of the preceding move has been retraced.
| Retracement depth | After a rise from 100 to 120 | After a fall from 120 to 100 |
|---|---|---|
| 23.6% | 115.28 | 104.72 |
| 38.2% | 112.36 | 107.64 |
| 50% | 110.00 | 110.00 |
| 61.8% | 107.64 | 112.36 |
| 78.6% | 104.28 | 115.72 |
Check the tool’s orientation before interpreting its labels. Some drawings measure upward from the low or reverse the displayed percentages. A level 38.2% of the range above the low is also a 61.8% pullback from the high. Compare the actual price and anchors, not only a label such as “0.382.”
These calculations use arithmetic price distance. A logarithmic-price calculation, where supported and selected, uses proportional spacing instead and can give different intermediate prices. A logarithmic chart display does not by itself tell you how a particular drawing computes its levels; verify the drawing’s settings and coordinates.
Assign Each Timeframe a Specific Job
Choose intervals around the intended holding period and decision frequency. Weekly, daily and hourly views are one possible arrangement for a longer-horizon setup; daily, four-hour and 30-minute views are another. A four-hour, hourly and 15-minute combination can frame shorter research. These are examples, not instrument-specific rules that guarantee reliability.
| Role | What to establish | Timing check |
|---|---|---|
| Context view | The broader completed swing and market direction | Were both anchors known before the proposed trade? |
| Setup view | A distinct swing or price interaction within that context | Does it add information rather than duplicate the same anchors? |
| Entry view | The exact trigger, invalidation and order timing | Was the required candle complete when the decision was made? |
Use a consistent rule for selecting swings: for example, a defined pivot method or an explicitly documented completed move. A pivot that requires later bars for confirmation is not available at the earlier candle where it is eventually drawn. Likewise, the final high of an unfinished weekly candle cannot be used to justify a decision made earlier in that week.
Record the symbol, provider, session and anchor timestamps. Different data feeds or sessions can produce different highs and lows. Decide how anchors will be updated when a new extreme appears, and preserve the old version in the research record. Redrawing levels after seeing the outcome can make a failed setup appear successful.
Find Confluence with a Predefined Tolerance
Confluence means that two or more independently specified measurements fall near one another in price. It does not mean that the observations are statistically independent. Nested swings share price history, and adding more ratios or more timeframes increases the chance of finding an overlap somewhere.
Consider an illustrative completed rise from 100 to 120. Its 38.2% pullback is 112.36. A separately defined rise from 104 to 117.52 has a 38.2% pullback at 117.52 − 0.382 × 13.52 = 112.35536, or about 112.36 after rounding. That is a numerical overlap; it is not evidence that price must reverse there.
Set the proximity rule before testing. It might be expressed in ticks, a fixed price distance or a specified volatility-based amount, depending on the instrument and strategy. Do not use a universal 1% band: the same percentage can be much wider than a useful entry zone in one market and too narrow in another. State whether the rule compares level-to-level distance or overlapping bands around each level.
Distinguish confluence from copying a drawing. If the same 100 and 120 anchors appear on three chart intervals, the linear 38.2% level remains 112.36 on all three. Counting those copies as three confirming swings would overstate the evidence.
Read the Historical Setup Carefully
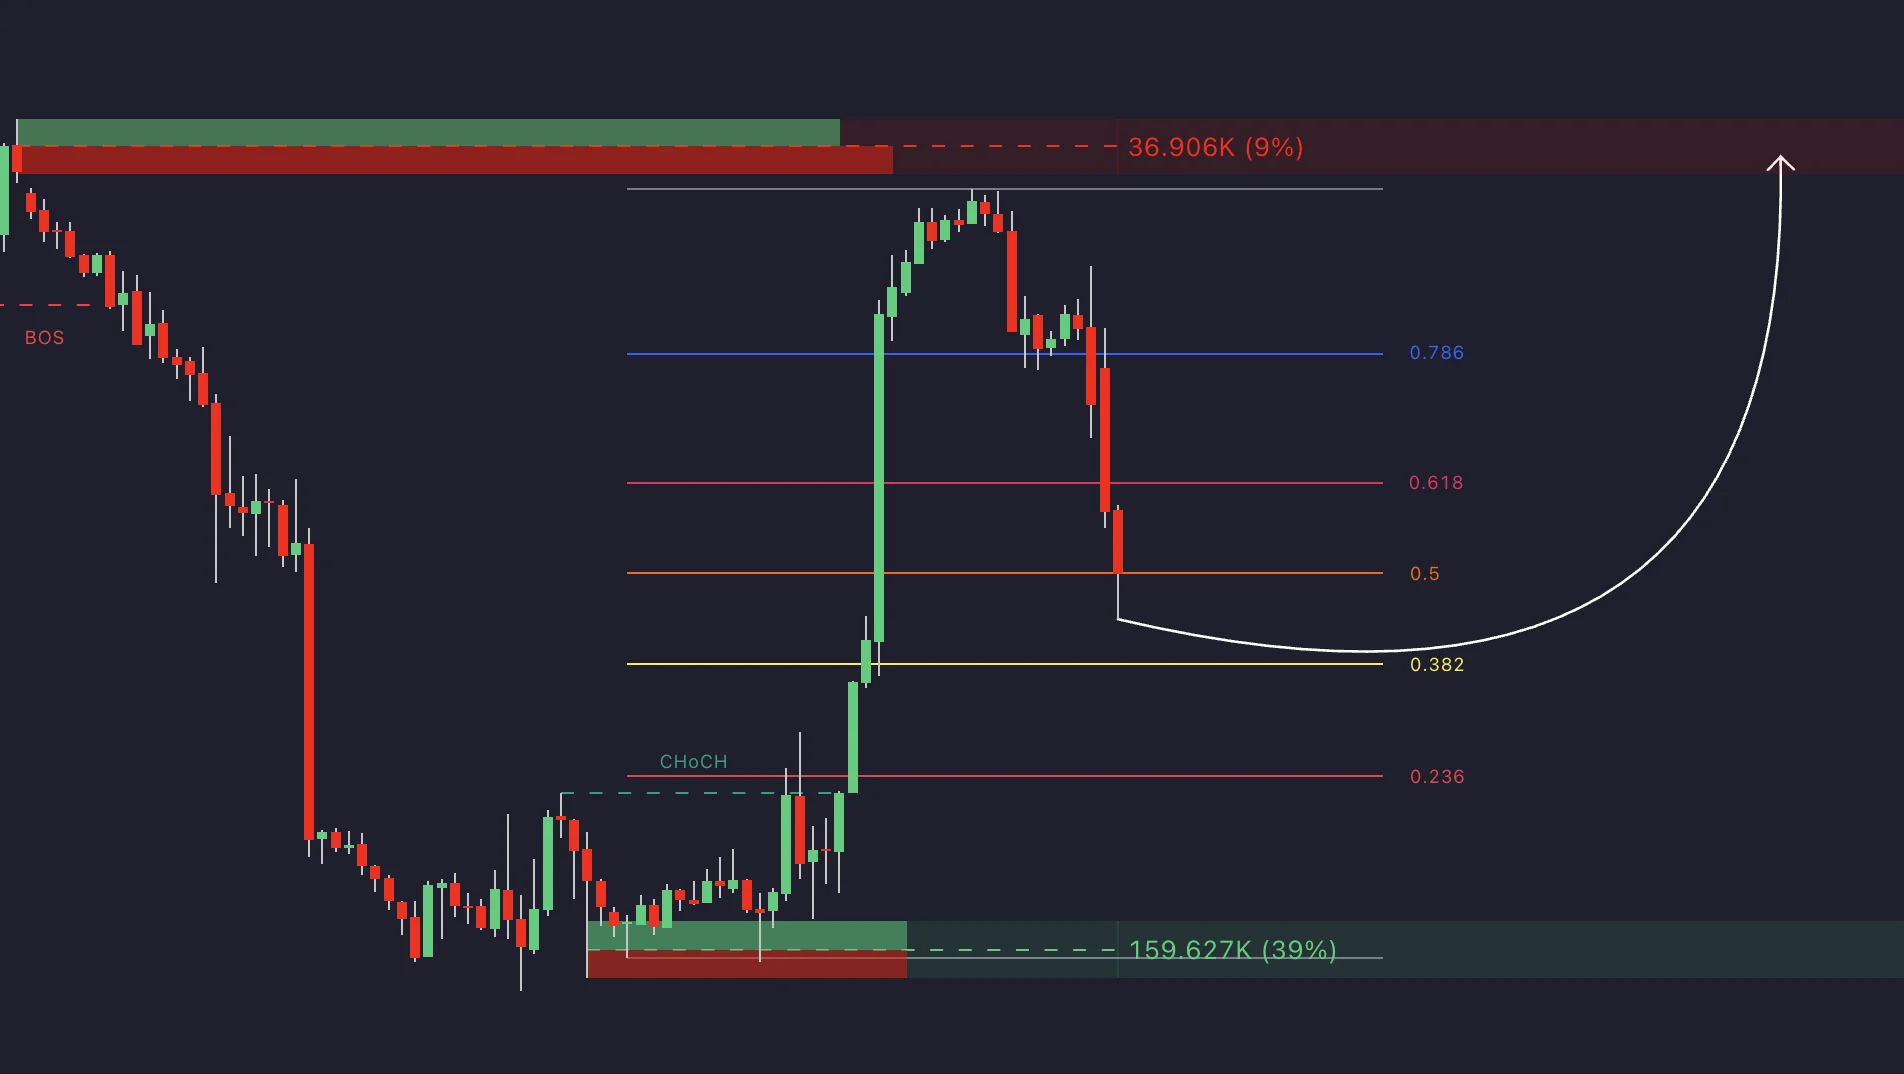
A bullish hypothesis might look for a pullback toward a pre-existing zone followed by a defined completed-bar recovery. A bearish hypothesis might look for a rebound into a resistance zone followed by a defined failure. Specify the trigger, whether entry occurs on the next eligible price, and the condition that invalidates the idea. A touch alone is not a complete trading rule.
A moving average, momentum measure or volume observation can provide additional context, but assign it a precise purpose. An RSI divergence and an oversold reading are different conditions; neither guarantees a Fibonacci reversal. Compare the setup with and without the added filter, since it may remove winners as well as losers.
Separate Retracements from Extensions and Projections
A retracement measures a return through a prior move. A projection uses a reference move to estimate levels beyond or after it. Different tools use different anchor counts and label conventions, so “161.8%” is incomplete without specifying the formula and origin.
For a two-anchor upward extension measured from the original low, a rise from L = 100 to H = 120 gives L + 1.618 × (H − L) = 132.36. This is equivalently 61.8% of the original range beyond the high. A three-anchor projection of the same 20-point rise from a later pullback C = 110 gives C + 1.618 × 20 = 142.36. Those are different reference levels, even though both use 1.618.
A downward projection similarly subtracts the chosen multiple of the reference decline from its specified origin. Ratios such as 1.272 and 1.618 can define candidate targets, but targets are not guaranteed destinations. A trailing stop is a management rule that changes over time, not another fixed extension target.
Use LuxAlgo’s Native Drawing Workflow
In native charts, open the Fibonacci group on the left drawing toolbar. LuxAlgo’s drawing documentation explains that drawings are anchored in time and price and saved with the workspace. Use the tool’s anchor points to mark the chosen swing, and check the resulting price coordinates.
Magnet can snap anchors to nearby OHLC values, while the Object tree helps show, hide or lock drawings. Sync drawings on all charts copies drawings across cells in a multi-chart layout. Use it to keep markup consistent, but distinguish those synchronized copies from levels based on a genuinely different swing.
Automated levels from the Library, such as the Fibonacci Toolkit, plot on a Quant Chart. Record the source swing and the time it became available when using automated levels in historical analysis; the anchors do not always match a manual swing definition.
Choose Risk from the Trade Plan, Not the Number of Lines
More overlapping levels do not justify automatically risking more capital. Define a risk allowance that fits the broader strategy and account constraints, then derive position size from entry, invalidation distance and contract value. There is no universal requirement to risk 1–2% for three timeframes or halve exposure whenever trading against a higher-timeframe level.
For a linear instrument worth one quote-currency unit per price unit, a hypothetical entry at 112.60 and planned stop at 111.60 has one unit of price risk. A 100-unit risk allowance implies 100 units of position size before costs. A target at 115.60 offers three units of gross reward per unit, or 3:1 under those assumptions. Actual fills, fees, gaps, conversion and contract multipliers can change the outcome.
Do not place every stop a fixed 1–2% beyond a Fibonacci zone. Define what invalidates the setup and account for the instrument’s trading increments, spread and execution conditions. A stop trigger is not a guaranteed fill. If the required stop distance widens, reassess size instead of silently increasing total risk.
Test the Exact Anchor and Entry Rules
Ask Quant, our coding agent to express supported swing detection, level calculations, overlap tolerance and order rules. Inspect the generated code and run it manually. Confirm that a drawing or pivot is not treated as available before the information needed to construct it existed.
Review strategy settings and individual trades with costs and realistic timing. Label any approximation to a proprietary indicator and document unsupported data or execution behavior. A visually plausible chart is not a substitute for checking the simulated trades.
Keep development and later evaluation periods separate, record the variants tried, and compare the multi-timeframe rule with a simpler baseline. Review net returns, drawdown, average win and loss, trade count, exposure and holding time. No universal 55% win rate, 2:1 target or 15% drawdown threshold proves that a strategy is suitable or robust.
Video: Choosing a Timeframe for the Method
In this historical Simpler Trading video, Carolyn Boroden discusses choosing parameters around the timeframe being traded. It provides context for assigning different roles to chart intervals. Its examples are educational and do not establish the success rate of the rules described here.
Frequently Asked Questions
Do identical Fibonacci anchors on different timeframes create confluence?
They produce the same linear-price levels. Copies of one measurement should not be counted as independent swings or additional evidence.
Is 50% a Fibonacci ratio?
No. It is a commonly used midpoint retracement, but it is not derived as a Fibonacci-sequence ratio.
Does the 61.8% level guarantee a reversal?
No. It is a reference derived from selected anchors. A trading hypothesis still requires explicit entry, invalidation, risk and evaluation rules.
Why can two tools show different 161.8% targets?
They may use different anchor points, origins or calculation conventions. A two-anchor extension from the original low differs from a three-anchor projection from a later pullback.
How close must levels be to count as a cluster?
Define the tolerance before testing using units appropriate to the instrument and strategy. There is no universal percentage band that establishes a reliable reversal zone.
Read next