Concept
Regular Bullish/bearish Divergence
Regular Bullish/bearish Divergence is a Momentum & Oscillators concept. The Library holds 6 implementations, each one a working definition you can pull into Quant.
Top Regular Bullish/bearish Divergence indicators
The top custom implementations, built on the original standard Regular Bullish/bearish Divergence formula.
6 total
Want to trade Regular Bullish/bearish Divergence? Any of the 6 implementations below is one prompt away from a backtested strategy in Quant.
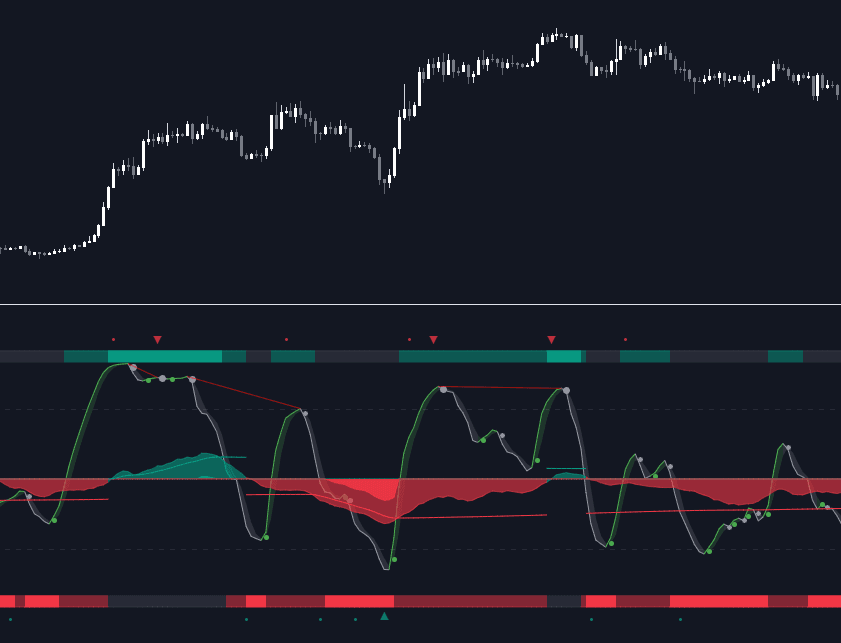
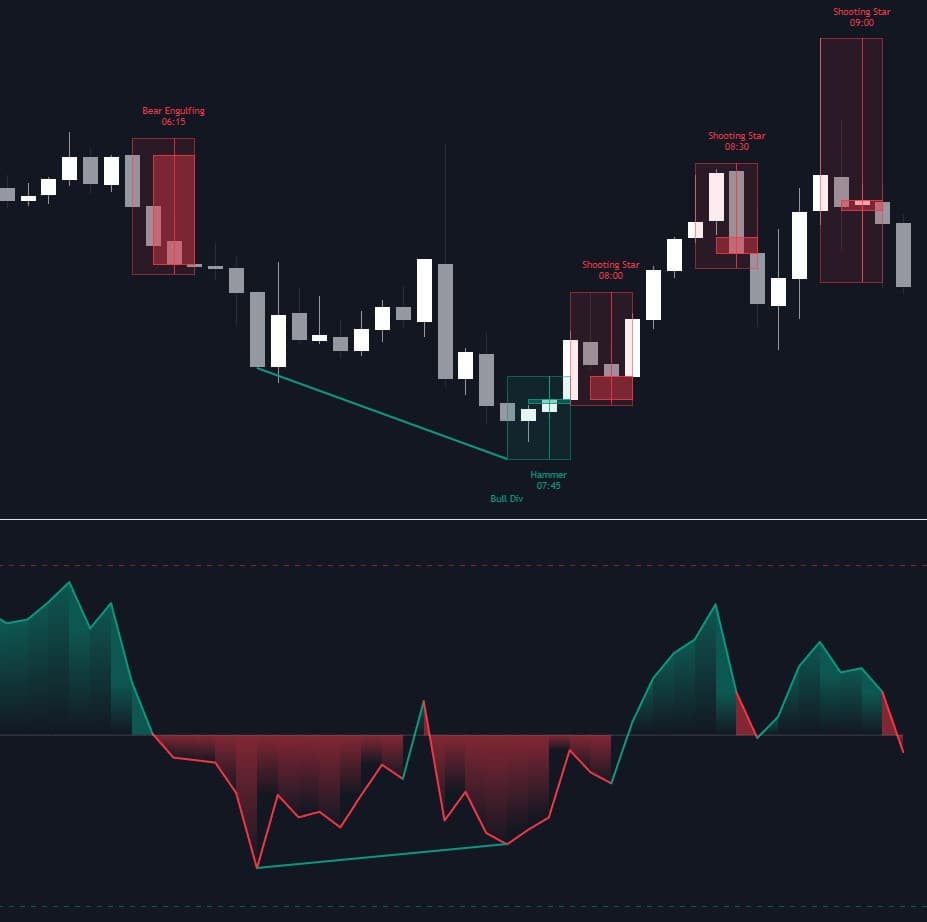
What is a Regular Bullish/bearish Divergence?
A regular divergence is a disagreement between price extremes and oscillator extremes. Bearish case: price prints a higher high while the oscillator prints a lower high. Bullish case: price prints a lower low while the oscillator prints a higher low. In both, the market reached a new extreme but the momentum behind it, as the oscillator measures it, did not. Regular (classic) divergence is therefore read as a reversal warning: the push that made the new extreme was weaker than the push before it.
The read is only as good as its anchors. Divergence is measured between confirmed swing points, matching each price pivot to the oscillator pivot produced by the same move, most commonly on RSI, the MACD line or histogram, or a stochastic. Sloppy anchoring, such as comparing a pivot to a mid-move wiggle, manufactures divergences that were never really there, which is one reason automated detectors disagree with each other.
Divergence matters because it is the shared grammar of the entire oscillator family: the same geometry carries the same meaning whatever is plotted in the pane. It is also famously early. Strong trends can print several divergences before turning, and some never resolve into reversals at all, so most serious treatments demand confirmation from price itself before a divergence becomes a trade.
How to identify regular divergence
Divergence detection is mostly anchor selection: pick the right pivots and the comparison itself is mechanical.
- 1Mark two successive confirmed swing extremes in price: two highs for a potential bearish divergence, two lows for a bullish one. Use completed pivots, not ones still forming; a divergence drawn on an unconfirmed pivot can vanish on the next bar.
- 2Find the oscillator pivots created by those same two moves. The pairing matters: each price swing should map to the oscillator swing it produced, not simply to the nearest wiggle in the pane.
- 3Compare slopes. Bearish regular: higher high in price, lower high in the oscillator. Bullish regular: lower low in price, higher low in the oscillator. If the lines disagree the other way around, on pullback pivots rather than extremes, you are looking at hidden divergence.
- 4Wait for confirmation before acting: a break of structure, a reversal candle, or the oscillator breaking its own trigger level. Divergence flags weakening thrust; it does not time the turn.
How traders use it
- As a reversal warning at extremes: divergence carries more weight where a turn was already plausible, such as at a higher-timeframe support or resistance zone, after an extended run, or alongside an exhaustion reading.
- As an exit or risk-reduction cue: momentum failing to confirm a new extreme against an open position argues for tightening the stop or scaling out, even for traders who would never enter on divergence alone.
- As a filter stacked with triggers: many rule sets require divergence plus a structural event, typically a break of the swing that formed it, precisely because raw divergence fires early and often.
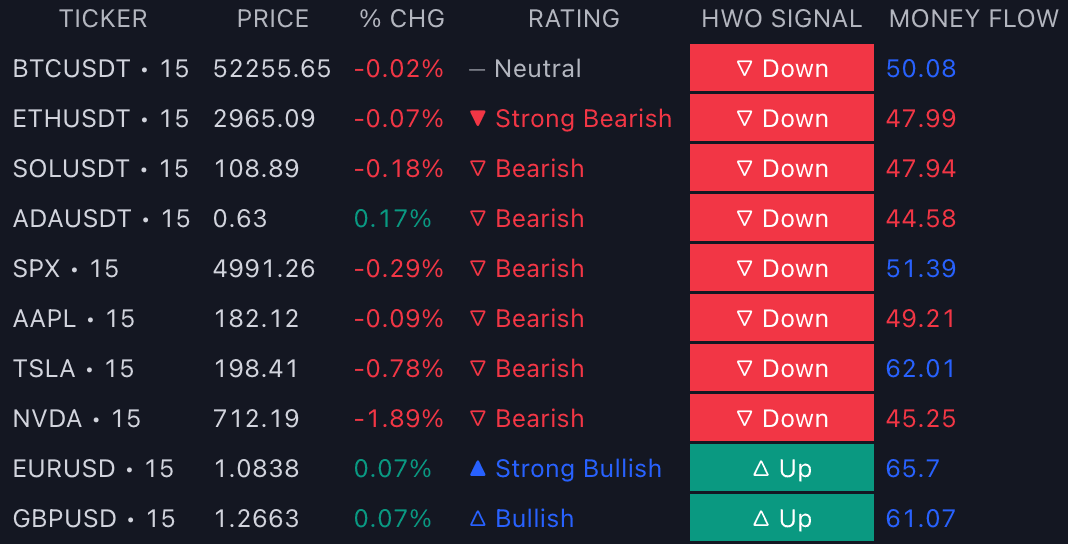
- As one component in screeners and scoring systems that scan many symbols or several oscillators at once and rank setups by how many independent conditions agree.
Regular divergence vs related concepts
Hidden Divergence: Opposite geometry, opposite message: regular divergence compares successive extremes and warns of reversal, while hidden divergence compares pullback lows or rally highs and argues for trend continuation. Mixing up which pivots to compare is the most common divergence error.
Smart Money Technique Divergence: SMT divergence is measured between two correlated instruments: one makes a new extreme and the other fails to. The failure-to-confirm logic is the same, but the inputs are two price series rather than price and an oscillator.
Volume Divergence: Compares price extremes to volume or volume-derived lines rather than to a momentum oscillator: new highs on shrinking volume question participation, not velocity. Often stacked with regular divergence as a semi-independent piece of evidence.
Overbought/oversold: An extreme reading is a level statement (the oscillator is unusually high or low); divergence is a shape statement (its extremes disagree with price's). An oscillator can be deeply overbought with no divergence, and a divergence can form entirely inside the neutral zone.
More Regular Bullish/bearish Divergence implementations
Concept family
Momentum & Oscillators
91 concepts mapped · 91 in the Library
Regular Bullish/bearish Divergence FAQ
Turn Regular Bullish/bearish Divergence into a trading strategy.
Take any implementation from this page into Quant, then build on it, backtest it on real data, and keep refining it in conversation.