Psychology of Risk-Reward in Pattern Trades

Pattern trading asks you to make decisions under uncertainty. A recognizable flag, wedge or double top can help describe a setup, but its shape does not establish a profitable trade. The psychology of risk–reward is about following a defined plan while staying willing to question the evidence behind it.
Start with a clear entry, an invalidation level, an exit rule and a position size. Then compare the outcomes the strategy actually achieves. LuxAlgo’s AI trading and charting platform brings native charts, Quant strategy development and a Journal into that research and review process.
Key Psychological Factors Affecting Risk-Reward Decisions
Fear and Greed Can Change the Plan
Fear can lead to closing a position before the planned exit, avoiding a qualifying trade after a loss, or reducing size inconsistently. Greed can encourage chasing an entry, moving a target farther away or increasing exposure after a winning streak. These behaviors matter when they change the assumptions on which the strategy was tested.
An early exit is not automatically a mistake: it may follow a valid rule for changed conditions. Record why it happened and whether that reason was part of the plan. Judge the decision using the information available at the time, rather than labeling every winning trade disciplined and every losing trade emotional.
Confirmation Bias and Overconfidence
After a profitable wedge trade, it is easy to notice similar-looking successes and overlook failures. For example, a trader reviewing broadening wedges might keep adjusting the trendlines until the chart fits the desired interpretation. Write down the pattern definition, entry trigger and invalidation rule before evaluating the result.
Look for evidence against the setup as well as evidence supporting it. Include failed patterns and skipped signals in the review. Several indicators derived from the same price series may repeat one message; agreement between them does not necessarily provide independent confirmation.
Loss Aversion and the Illusion of Control
Reluctance to realize a loss can turn a planned exit into an open-ended hope for recovery. A detailed chart or polished backtest can also create more confidence than the evidence supports. Tools make assumptions easier to inspect; they cannot remove market uncertainty or guarantee self-control.
Separate two questions: did you follow the rule, and does the rule deserve to be followed? Consistent execution of a weak strategy can still lose money. Repeated rule changes after individual losses can make even a reasonable strategy impossible to evaluate.
Implementing Risk-Reward Ratios in Pattern Trading
Use One Ratio Convention
In this article, risk-to-reward means planned loss compared with planned gain. Risking one unit to target three is 1:3 risk-to-reward, or equivalently 3:1 reward-to-risk. State the convention because trading resources sometimes reverse the order.
For a hypothetical long EUR/USD trade entered at 1.1200, a stop at 1.1150 is 50 pips below entry and a target at 1.1350 is 150 pips above it. The planned risk-to-reward ratio is 1:3 before spreads, commissions, financing and execution differences. Those prices are an arithmetic example, not a current setup or evidence that the target is likely to be reached.
A larger target does not automatically improve a strategy. Moving the target farther away can reduce the fraction of trades that reach it. Moving the stop closer can increase the frequency of stop-outs. Define levels from the trading hypothesis and test the resulting distribution of outcomes.
Connect the Exit Distance to Position Size
A ratio does not tell you how much money is at risk. CME Group’s position-sizing lesson connects the planned exit distance with the amount allocated to risk. For a simple cash-stock example, a $2 entry-to-stop distance and a $100 planned loss budget imply 50 shares before costs and execution allowances.
For futures or other contracts, include the contract multiplier or tick value and any currency conversion. A wider stop generally requires a smaller position to retain the same planned loss budget. Margin required to open a position is a different measure from its potential loss.
A stop price is not a guaranteed fill. The SEC’s stop-order bulletin explains that a triggered stop becomes a market order and can execute away from the trigger; a stop-limit order can remain unfilled. Gaps and thin liquidity can therefore make the actual loss exceed the initial estimate.
Adapt the Test to the Market
There is no universal “typical” ratio for stocks, cryptocurrency or forex. The instrument, interval, liquidity, costs and exit logic matter more than assigning a fixed target to an asset class.
| Illustrative setup | Define before testing | Market-specific checks |
|---|---|---|
| Stock bullish flag | Flag boundaries, breakout timing and invalidation. | Opening gaps, earnings, liquidity and session rules. |
| Cryptocurrency wedge | Required touches, breakout confirmation and exit. | Venue data, continuous trading, spreads and funding where applicable. |
| Forex double top | Peak tolerance, neckline trigger and invalidation. | Session changes, news, spread variation and rollover costs. |
Measure Realized Expectancy
A planned 1:3 setup does not mean average winners will equal three times average losers. Partial exits, missed fills, trailing stops and discretionary changes can all alter that relationship. Evaluate the realized averages and costs, as well as win rate.
Net expectancy = win rate × average win − loss rate × average loss − average cost per trade.
For example, if wins average 3R and losses average 1R, a 30% win rate gives 0.30 × 3R − 0.70 × 1R = 0.20R before costs. Average costs of 0.10R reduce that to 0.10R. The before-cost break-even win rate is 25% under those assumptions; with that cost it rises to 27.5%. This hypothetical calculation uses realized averages, not merely a target drawn on a chart.
CME Group’s expectancy lesson explains why win rate alone is insufficient. A positive sample estimate is still uncertain, especially with few trades or when many variations were tried. Review drawdown, loss streaks and performance on data not used to select the rules.
Use LuxAlgo to Test Pattern Rules
Inspect the Setup on Native Charts
Open the relevant symbol on LuxAlgo’s native charts, set the interval and session, and add only studies that answer a defined question. A trend or volume study can provide context; it does not prove a pattern will succeed. Verify data coverage before comparing instruments or assuming an Order Flow study is available.
Turn the Pattern into Explicit Rules with Quant
Quant is LuxAlgo’s coding agent for building and refining indicators and strategies from plain-language instructions. A useful request names the instrument context, pattern definition, entry timing, stop, target and sizing method. “Trade good wedges at 1:3” leaves too much undefined.
For a double-top idea, specify how peaks are identified, how similar their prices must be, how the neckline is defined and what confirms the entry. If a pivot requires later bars for confirmation, the strategy must wait for that confirmation; recognizing a peak retrospectively is not an available entry signal at the peak itself.
Review the generated Code, run the strategy and inspect individual trades. Use Quant’s strategy controls to check sizing, commissions and slippage assumptions. Compare alternative exits over the same data and reserve a separate period for validation. A script that compiles or a backtest that looks attractive does not establish a live trading edge.
Native chart alerts require their own configuration; a saved Quant strategy does not automatically monitor every watchlist symbol.
Incorporating Psychological Awareness into Trading
Build a Routine You Can Review
| Decision problem | Practical response | What to record |
|---|---|---|
| Fear after a loss | Check the next setup against the written rule. | Whether it qualified and why you took or skipped it. |
| Chasing or increasing size impulsively | Recheck the entry and risk budget before acting. | Any departure from planned timing or size. |
| Moving an exit to avoid a loss | Apply the predefined exit or contingency rule. | The original level, actual exit and reason for a change. |
| Fatigue or overloaded attention | Use planned review windows and breaks. | Missed checks and whether workload affected execution. |
Review Actual Trades in the Journal
Record planned entries, exits and risk alongside actual fills, costs, position size and the reason for each decision. Compare rule compliance separately from profit and loss. A profitable unplanned trade can still expose a process problem, while a planned loss may be a normal strategy outcome.
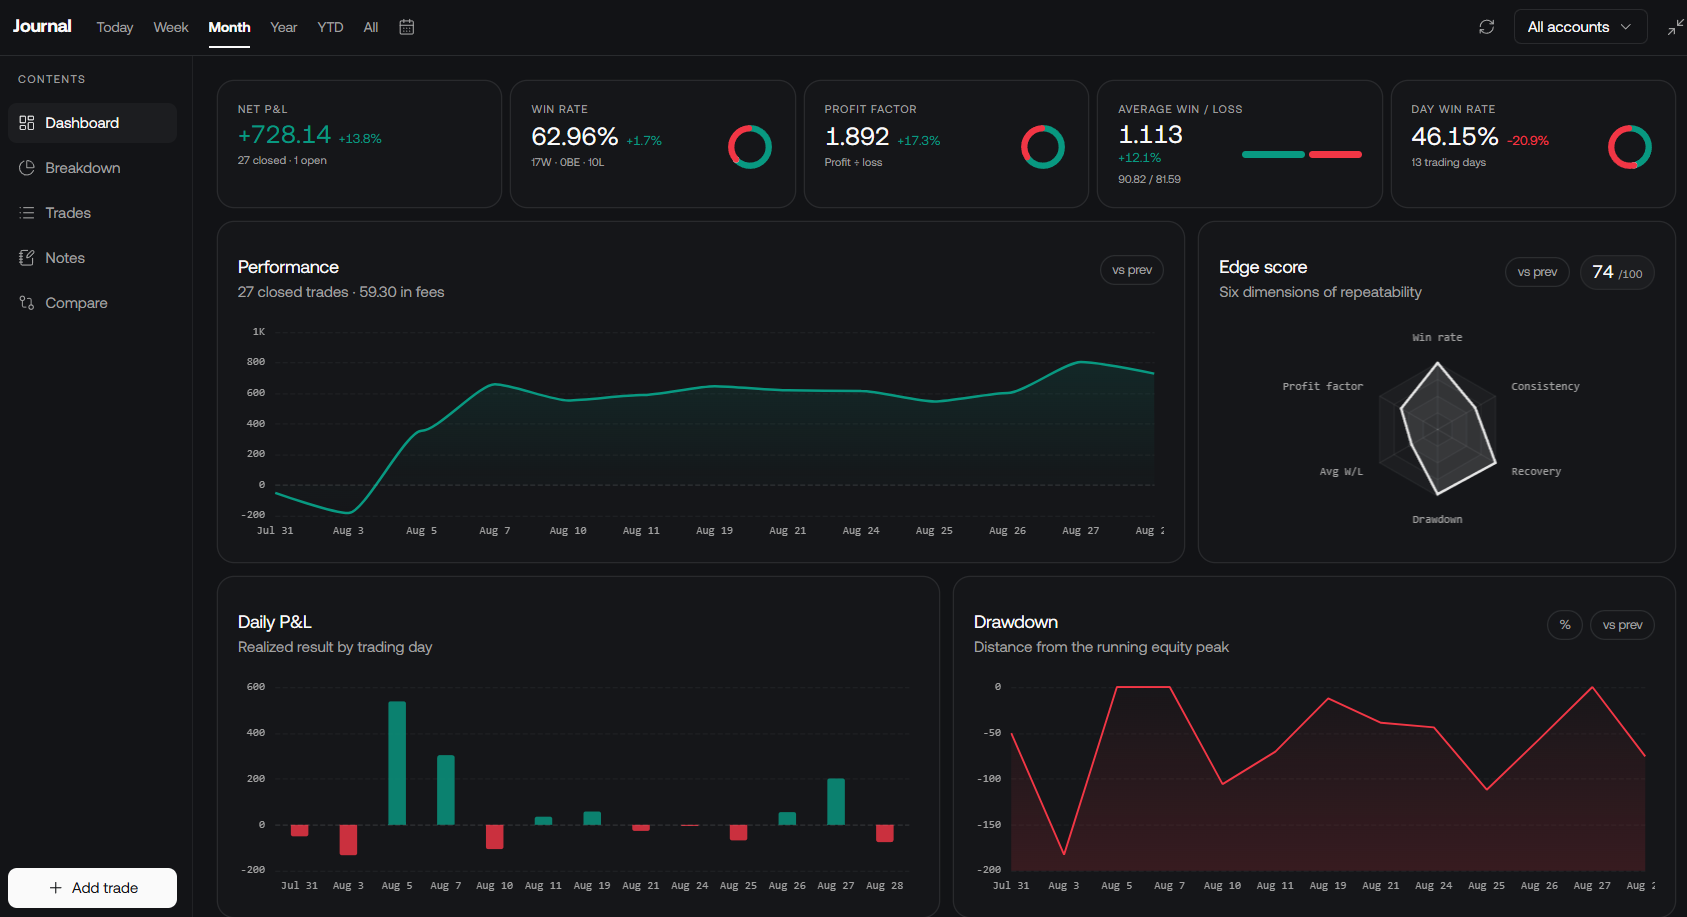
Journal accounts support manual records, supported file imports and broker connections where available for the account. Check the completeness of fills and costs before interpreting the analytics. Keep actual trading records distinct from simulated Quant results.
Review a meaningful sample on a regular schedule. If early exits repeatedly shrink average winners, test the proposed exit rule separately rather than assuming more discipline will fix it. If losses occur despite correct execution, investigate the strategy, market conditions and costs before attributing them to psychology.
Use Community Feedback Carefully
Trading communities can help you explain a setup and hear alternative interpretations. Share the rule, assumptions and losing examples as well as attractive screenshots. Agreement from other traders is not validation, and someone else’s risk tolerance should not determine your position size.
Next Steps for Pattern Traders
Choose one clearly defined pattern and write down the ratio convention, entry, invalidation, exit and sizing rules. Test those rules with realistic assumptions, then use the Journal to compare planned and actual decisions. Keep useful changes supported by evidence and continue checking them as conditions change. Emotional awareness supports that process; it cannot substitute for a strategy with acceptable net outcomes and risk.
Read next