Concept
Advance/decline Internals
Advance/decline Internals, also known as A/D line, A/D ratio, ADD, Absolute Breadth Index, are Breadth, Sentiment & External Data concepts. The Library holds 1 implementation, a working definition you can pull into Quant.
Top Advance/decline Internals indicator
The top custom implementation, built on the original standard Advance/decline Internals formula.
1 total
The Advance/decline Internals implementation below can become a backtested trading strategy — describe your rules and Quant writes the code.
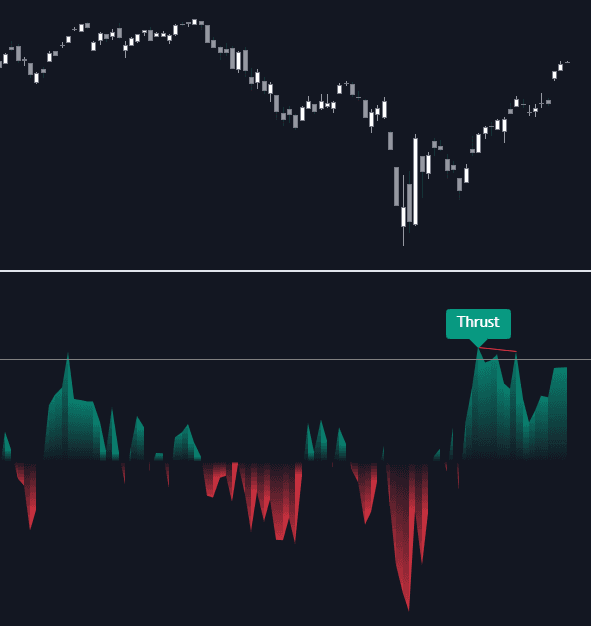
What are Advance/decline Internals?
Advance/decline internals are the breadth statistics built from two counts: how many issues on an exchange closed higher (advances) and how many closed lower (declines). The A/D line is the running sum of advances minus declines and is the classic participation gauge. The A/D ratio divides advances by declines for a normalized single-day reading. Net advances (quoted intraday as ADD) is the raw difference. The Absolute Breadth Index takes the absolute value of that difference, measuring how one-sided activity is regardless of direction, and STIX exponentially smooths advances as a share of advances plus declines.
Breadth counting is among the oldest branches of market analysis. Daily tabulations of advances and declines were being kept by the mid-1920s, work commonly credited to Leonard Ayres and his colleagues at the Cleveland Trust Company, and the cumulative A/D line became a fixture of mid-century market commentary. Later analysts built named tools on top of the counts: Sherman and Marian McClellan derived their oscillator and summation index from smoothed net advances in 1969, Norman Fosback introduced the Absolute Breadth Index in the 1970s, and STIX came from the Polymetric Report advisory letter.
These matter because capitalization-weighted indices can be carried by a handful of megacaps while the average stock deteriorates. Internals count every issue equally, so they expose narrowing participation before it shows in price. The standard caveat: breadth warnings can persist for months before price cares, and exchange composition (funds and preferred issues on the NYSE tape) can tint the counts.
In modern practice the counts sit inside a wider internals dashboard. Intraday index traders read net advances alongside the TICK index, which counts stocks upticking versus downticking in real time; position traders pair the A/D line with level-based participation gauges such as the percentage of stocks above their 20-, 50-, and 200-day averages. The counts remain equity-specific: they need a broad reported issue universe, which is why breadth work centers on NYSE and Nasdaq data.
How to read advance/decline internals on a chart
Breadth is read against the index it describes: plot the internal beneath the benchmark.
- 1Load the exchange's breadth series (advancing issues, declining issues, or net advances under symbols such as ADD) or a toolkit study that computes them.
- 2Plot the cumulative A/D line under the index and compare swing highs and lows: confirmation means both series printing new extremes together.
- 3Mark sessions where the index makes a new high the line fails to match, and track whether that divergence repeats at subsequent highs.
- 4For single-day readings, use net advances or the A/D ratio: days where one side overwhelms the other flag potential thrusts or washouts.
- 5Note the universe behind the counts: NYSE all-issue data includes funds and preferred shares, so a common-stock-only or index-specific breadth series makes a useful cross-check.
How it's calculated
Breadth measures built from the counts of advancing and declining issues on an exchange for each session.
The A/D line's absolute level depends on its start date, so its slope and divergences against price carry the information.
Unchanged issues are excluded above; some variants normalize net advances by total traded issues instead.
ADD usually names the intraday NYSE advance/decline difference updated through the session.
How traders use it
- As trend confirmation: index highs accompanied by A/D line highs indicate broad participation, while price highs the line fails to confirm set up the classic breadth divergence at index tops.
- As thrust and washout detection: rare stretches where advances overwhelm declines feed breadth-thrust definitions, and deeply lopsided down days mark potential capitulation.
- As raw material: smoothed net advances drive derived tools such as the McClellan Oscillator and its summation index, so reading the inputs helps sanity-check the derivatives.
- As a volatility cross-check: deteriorating breadth alongside a rising VIX or firming implied volatility describes a market losing sponsorship, while breadth weakness volatility ignores may reflect rotation rather than broad distribution.
- As a price-based sanity check: ratio charts of an equal-weight index against its cap-weighted version, or a relative strength comparative line between the two, ask the same participation question using only price.
Advance/decline internals vs related breadth measures
McClellan Oscillator: A derivative: the difference between two exponential moving averages of daily net advances. It converts the raw counts into a momentum-of-breadth reading, and its summation index cumulates that into a slower gauge.
TICK Index: A real-time count of NYSE stocks on upticks minus those on downticks. It measures the moment's pressure, while daily advance/decline counts settle the question at the close.
% Stocks Above 20/50/200-day MA: Participation measured by level rather than daily change: the share of issues holding above a reference average. It moves more slowly than day-count breadth and answers how many stocks remain in uptrends, not how many rose today.
Concept family
Breadth, Sentiment & External Data
63 concepts mapped · 63 in the Library
Advance/decline Internals FAQ
Turn Advance/decline Internals into a trading strategy.
Take the implementation from this page into Quant, then build on it, backtest it on real data, and keep refining it in conversation.