Pyramiding Strategies: Scaling Into Trades To Boost Returns
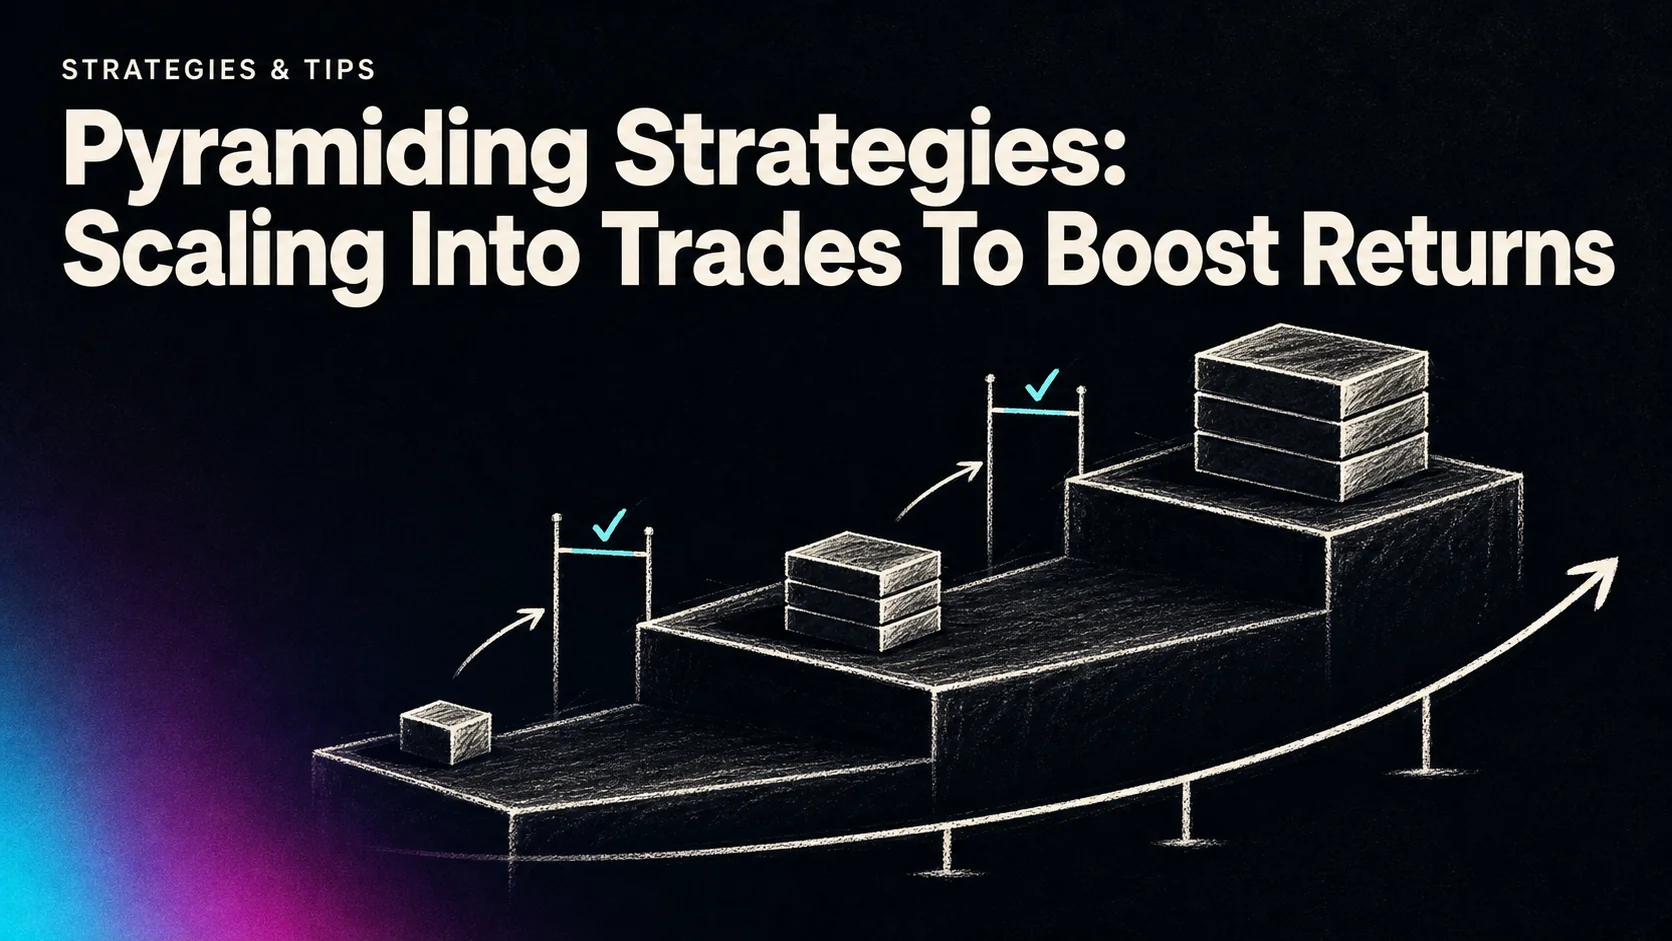
Pyramiding means adding to a position after the market moves in its favor. It can increase participation in a sustained trend, but every addition also increases exposure. Unrealized gains are not free capital, and moving a stop does not guarantee that a profitable trade will remain profitable.
A workable pyramiding plan defines the initial entry, each addition, the maximum position, and the exit before the sequence begins. The key question is not simply whether the first entry is winning. It is whether the combined position still fits the risk and execution assumptions after the next order.
- Start with a position sized from a defined cash risk budget and stop distance.
- Add only after the chosen continuation condition occurs.
- Recalculate the weighted entry price, total exposure, and stop-out scenario after every addition.
- Set a maximum number of entries and a rule for canceling unused additions.
- Compare the scaled strategy with an otherwise equivalent single-entry version.
Basic Rules of Pyramiding
Start with a Defined Position and Add to Strength
In a long position, favorable movement means price has risen; in a short position, it means price has fallen. The trend may be described using swing structure, a moving-average rule, or another testable condition. None can establish in advance that the move will continue.
Do not confuse position value with planned loss. Allocating 1–2% of an account to shares is different from risking 1–2% of account equity between the entry and intended stop. Leveraged instruments add further differences between margin posted, notional exposure, and potential loss.
Equal-sized and progressively smaller additions are common ways to structure a pyramid. Neither is automatically safe. The actual risk depends on the prices, quantities, stop rules, costs, and what happens if execution differs from the plan.
Keep Pyramiding Separate from Averaging Down
Adding after an adverse move is not the trend-following pyramiding approach described here. Do not relabel an unplanned attempt to recover a loss as scaling into a winner. A profitable first entry can also conceal a poor later entry, so review each addition as a new decision.
For example, buying at $50 and adding at $55 raises the average purchase price. A subsequent decline may leave the original lot profitable while the newest lot is losing. The combined result, rather than the status of the first lot alone, determines the outcome of the sequence.
Choose a Scaling Method Without Assuming a Risk Ranking
| Method | How additions are defined | Risk question to answer |
|---|---|---|
| Fixed units | Add the same number of shares or contracts at each qualifying stage. | How much does the growing position lose if it returns to the stop? |
| Decreasing units | Add smaller quantities as the move progresses. | Is the total exposure still acceptable despite smaller later orders? |
| Fixed notional amount | Allocate the same cash value to each addition. | What quantity and stop-based loss does that amount create at the new price? |
| Volatility-based size | Calculate units from a defined volatility or stop-distance rule. | Does the calculation include the existing position and changing volatility? |
| Time-based review | Consider an addition at scheduled intervals if the favorable-move and setup rules still hold. | Are you adding because conditions qualify or merely because time has passed? |
A fixed dollar allocation does not produce fixed risk unless the relevant stop distance and unit value also support it. Labels such as “reverse pyramid” are used inconsistently; write the actual quantities and triggers instead of relying on a label.
How to Implement Pyramiding Step by Step
1. Define the Trend and Initial Setup
Choose the market, interval, and trend rule before trading. An educational daily-chart filter could require price above a rising 50-day moving average, with the average higher than it was five completed sessions earlier. A short-side version could reverse those conditions. This is a research example, not a universally profitable filter.
Higher highs and higher lows can provide context for a long setup; lower highs and lower lows can provide context for a short. Record how swings become confirmed so that a historical chart does not give the strategy information earlier than it was available.
Volume and liquidity serve different purposes. A volume filter may describe participation in the selected feed, while the spread and available size affect execution. A busy market is not automatically a persistent trend, and a trend can continue with fluctuating volume.
2. Specify Each Addition
Possible triggers include a new breakout, a qualifying pullback, or a stated favorable percentage move. If you choose “add after a 2% move,” define whether that means 2% from the initial entry or from the most recent addition, and whether the trigger uses a touch or a completed close.
Set the quantity, maximum additions, permitted order timing, and cancellation conditions in advance. If several levels are crossed in one fast move, decide whether the plan allows several additions or only one. Do not assume all orders can execute at the prices shown on the chart.
A pullback entry should also have an explicit invalidation. A Fibonacci level, moving average, or prior breakout area can be a reference, but the level itself is not evidence that the trend will resume.
3. Check the Whole Position Before Adding
Before sending another order, calculate the total units, weighted average entry, notional exposure, and result at the proposed stop. Include outstanding entry orders: they can increase exposure even if they have not executed yet.
Check that the stop remains technically and operationally meaningful. Moving it closer solely to make an oversized addition appear affordable changes the strategy and can increase the likelihood of an exit during normal price movement.
4. Define When to Stop Adding and Exit
Stop adding when the maximum size or entry count is reached, the continuation rule fails, the remaining reward no longer fits the plan, or execution conditions become unacceptable. Decide separately whether those conditions require closing the existing position.
A trailing exit might follow confirmed higher lows for a long or lower highs for a short. Alternatively, the sequence may use a fixed structural stop, a time exit, or a target. Specify whether one stop closes all lots or each lot has its own exit.
For live trading, verify amendments, filled quantities, and remaining orders. A chart line does not confirm that a broker accepted a new stop or that every lot is covered.
Worked Example: Four Entries in an Uptrend
Consider the original sequence of 100 shares at $50, followed by 50 at $52.50, 25 at $55, and 12 at $57. The following table adds explicit hypothetical common stops. Assume every entry and exit executes at the stated price, with no costs, financing, or earlier exits.
| Stage | New purchase | Total shares | Weighted entry | Common stop | Combined P/L at stop |
|---|---|---|---|---|---|
| Initial | 100 at $50.00 | 100 | $50.00 | $48.00 | −$200 |
| Add 1 | 50 at $52.50 | 150 | $50.83 | $50.00 | −$125 |
| Add 2 | 25 at $55.00 | 175 | $51.43 | $52.00 | +$100 |
| Add 3 | 12 at $57.00 | 187 | $51.79 | $54.00 | +$414 |
Total purchase cost is $9,684 for 187 shares. At $57, the position is worth $10,659, producing an unrealized gain of $975. If all shares subsequently exit at $54, proceeds are $10,098 and the gross gain is $414.
Those numbers describe two different risks. The hypothetical $54 exit is profitable relative to purchase cost, but it gives back $561 from the position’s value at $57: 187 × ($57 − $54). A stop that is above the average entry does not eliminate the risk of losing accumulated equity.
Nor is $414 locked in. If a gap leads to an actual exit at $50, the sequence loses $334 before costs: (187 × $50) − $9,684. More severe adverse execution would produce a larger loss.
The stops in the table are assumptions for illustrating arithmetic, not recommended levels. Each would need to fit the strategy, and the trader would need enough buying power for the growing position. Earlier unrealized gains do not make the additional shares free.
Compare with Holding Only the Initial Position
At $57, the initial 100 shares alone would show a $700 gross gain. The full sequence shows $975, but uses more capital and carries more exposure. If both alternatives then exited at $54, the original 100 shares would earn $400 while the pyramid would earn $414. The extra gain depends on the path and final exit, not just the presence of additions.
A fair strategy comparison should report drawdown, capital usage, costs, and missed or failed additions alongside profit. Comparing only a selected trending winner can hide the cost of scaling during reversals.
Managing Risk When Pyramiding
Use a Combined Stop-Out Calculation
For long shares with one common exit price, gross position P/L at that price equals total shares × exit price − total purchase cost. With separate stops, calculate each lot’s result at its own assumed exit and add the results. That remains a scenario calculation, not a guaranteed outcome.
For a short position, the price arithmetic reverses: entry proceeds minus repurchase cost, before fees and borrowing costs. Short stock also has different risks, including borrow availability and potentially unbounded losses as price rises. Futures and forex calculations must use the appropriate contract or pip value.
Distinguish planned loss relative to the entry capital from potential giveback relative to current equity. You may set limits on both. Otherwise, a sequence that is nominally “risk-free” because its stop is above entry can still surrender a substantial open gain.
Understand What Stops Can and Cannot Do
Investor.gov’s order guide explains that a stop-market trigger does not guarantee an execution price, and a limit order may not execute. Stop adjustments can change the planned exit; they cannot remove gap or liquidity risk.
Moving the original lot’s stop to its entry price does not put the entire pyramid at breakeven. Later lots may have different purchase prices, and fees affect the combined result. Recalculate after every addition instead of reusing the original risk figure.
Set Position, Portfolio, and Session Limits
Define the maximum total size, buying-power usage, planned loss, and acceptable giveback for the full sequence. Also account for other positions exposed to the same market move. Several pyramids in related assets can build correlated risk.
A percentage risk limit is a planning choice, not a universal recommendation. If a session limit is reached, follow the predetermined exposure-reduction or exit procedure and verify the resulting positions and orders. Do not assume that a daily limit guarantees an exact final loss.
Using LuxAlgo to Plan and Test Additions
Keep Candidate Markets and Levels Organized
Use LuxAlgo charts to mark the initial setup, potential additions, and invalidation levels. Choose relevant indicators from the Library and keep their settings consistent during the test.
The Watchlist keeps selected symbols together and lets you load one into the active chart. Treat it as an organizational tool; a symbol appearing on the list does not mean your addition rule has triggered.

Orderflow measures can add context about participation, but they cannot prove continuation or institutional identity. Check the selected instrument’s data coverage before interpreting volume or delta. A venue-specific feed does not represent every trade across the market.
Describe the Full Sequence to Quant
Quant, our coding agent, can help express a pyramiding plan as strategy code. Describe the initial entry, each addition, quantities, stop updates, maximum entries, and cancellation rules. Include whether signals use completed bars and how simultaneous triggers should be handled.
A research request might be: “Compare an initial-entry-only strategy with a version allowing three progressively smaller additions after specified favorable moves. Keep the trend and exit rules consistent. Show combined exposure, explain stop handling for all lots, and include costs.” Supply exact parameters before interpreting the results.
Follow the Quant strategy workflow: review the code, run it, and inspect Inputs and Properties. Properties includes pyramiding, order size, capital, commission, slippage, and margin. Verify the actual simulated number and size of entries rather than assuming the setting alone enforces every intended risk limit.
For Pine Script® implementations, TradingView’s strategy documentation distinguishes strategy.entry(), which interacts with the pyramiding setting, from strategy.order(), which does not use that setting in the same way. Multiple price-triggered orders can also require special care. Inspect the generated logic and actual trade sequence.
Evaluate the Entire Trade Sequence
Use the strategy results and Trades Log to verify every addition and exit. Check whether an exit covers all intended lots and how the simulation handles a bar that reaches both an addition level and a stop.
Compare net profit, drawdown, average winning and losing amounts, costs, and peak exposure against a consistent baseline. Keep entry count separate from completed position sequences; several entries can belong to one overall trade idea.
Test trending and choppy periods, higher execution costs, and a later period not used to develop the rules. A trend-following system need not make money in every regime, but its losing conditions and capital requirements must be visible. Forward practice can help reveal operational problems that a historical test misses.
Keep records of intended versus actual additions and stop changes in LuxAlgo’s Journal. A saved Quant backtest does not automatically create live orders or an alert subscription.
Common Mistakes to Avoid
- Measuring only the newest lot: Include the existing position and any working entry orders.
- Treating open profit as free money: A reversal can erase gains and affect the original capital.
- Adding because the chart moved: Require the predefined trigger, valid stop, and acceptable combined exposure.
- Moving stops just to justify size: The resulting exit must still make sense within the tested plan.
- Assuming smaller additions are always low risk: Total units continue to grow, even when each new order is smaller.
- Requiring an arbitrary reward ratio: No universal 1:3 target establishes an edge. Evaluate realized payoffs, hit rate, and costs.
- Ignoring reversals and missed fills: Include unsuccessful sequences and execution limitations in the review.
What Is Pyramiding in Trading?
This VRDNation explainer introduces the scaling concept. Use the combined-position calculations above when evaluating examples, rather than assuming that adding to a winner leaves risk unchanged.
Build the Plan Before Building the Position
Pyramiding can capture more of a sustained move, but its value depends on when additions occur, how much exposure they create, and how the full position exits. Recalculate risk at every stage and compare the results with a simpler alternative.
LuxAlgo charts, Watchlist, Quant, and Journal can support preparation, testing, and review. Use them to make the sequence explicit before deciding whether its potential benefit justifies the added complexity and risk.
FAQs
What makes pyramiding unique compared to other trading strategies, and why should you only add to winning trades?
Pyramiding adds exposure after favorable price movement under predefined continuation rules. Adding after an adverse move is a different approach. Even when the first lot is profitable, each addition changes the average entry, exposure, and potential giveback, so calculate the combined position’s risk.
What are the most effective tools for confirming trends when using pyramiding strategies?
Moving averages, swing structure, ADX, momentum measures, and volume can help describe conditions, but none guarantees continuation. Choose a clear rule and test it with consistent data. Check spread and liquidity separately because execution affects the risk of every addition.
How can traders manage risk and set stop-loss levels effectively when using a pyramiding strategy?
Define the maximum entries and total exposure, then calculate each lot’s result at the planned exit after every addition. Track both loss relative to entry capital and giveback from current equity. Stops guide execution but do not guarantee a price or eliminate gap risk.
Read next