Treasuries Explained: Safe Investment Strategies in Uncertain Markets
U.S. Treasury securities are the debt of the federal government. When you buy one, you lend money to the Treasury and it promises to pay interest on a fixed schedule and to return the face value at maturity. Because they are backed by the full faith and credit of the United States, Investor.gov describes Treasuries as among the safest investments available, and their interest is exempt from state and local income tax. This guide explains the five marketable Treasury types as TreasuryDirect defines them, how their prices and yields are set at auction, what the yield curve tells you, the risks that still apply, and three structures investors use to hold them. It closes with how to follow Treasury exchange-traded funds alongside stocks in Quant Charts.
What Treasury Securities Are
Treasuries come in two broad families. Savings bonds such as Series EE and Series I are non-marketable: you buy them from the government and redeem them with the government. Marketable securities are the ones this article covers. They are sold at public auction, can be held to maturity or sold to another investor on the secondary market, and are issued only in electronic form. TreasuryDirect lists five marketable types: bills, notes, bonds, Treasury Inflation-Protected Securities (TIPS) and Floating Rate Notes (FRNs). Every one of them has a minimum purchase of $100 and sells in $100 increments.
Interest on all five is subject to federal income tax but not state or local income tax. That distinction matters most for investors in high-tax states comparing a Treasury with a bank certificate of deposit or a corporate bond of similar yield.
The Five Marketable Treasury Types
The table below is drawn from the individual product pages on TreasuryDirect. Terms, payment schedules and auction frequencies are set by the Treasury and change only when the Treasury announces a change.
| Security | Terms | How interest is paid | Coupon rate | Auctions |
|---|---|---|---|---|
| Treasury bills | 4, 6, 8, 13, 17, 26 and 52 weeks | Sold at a discount or at par; the difference from face value at maturity is the interest | Discount rate fixed at auction | Weekly for most terms; every four weeks for 52-week bills |
| Treasury notes | 2, 3, 5, 7 and 10 years | Fixed interest every six months | Fixed at auction, never below 0.125% | Monthly for 2, 3, 5 and 7 years; quarterly with reopenings for 10 years |
| Treasury bonds | 20 and 30 years | Fixed interest every six months | Fixed at auction, never below 0.125% | Four original issues and eight reopenings a year |
| TIPS | 5, 10 and 30 years | Fixed rate paid every six months on an inflation-adjusted principal | Fixed at auction, never below 0.125% | Original issues and reopenings spread through the year by term |
| Floating Rate Notes | 2 years | Interest every three months at a rate that resets weekly | 13-week bill discount rate plus a fixed spread | Original issues in January, April, July and October; reopenings in other months |
Treasury bills
Bills are the short end of the market. They do not pay coupons. Instead you buy at a price below face value and receive the full face value at maturity, and the gap is your interest. TreasuryDirect gives the price formula as face value multiplied by one minus the discount rate times the days to maturity divided by 360. Its example is a 26-week bill auctioned at a 0.145% discount rate, which prices at $999.27 per $1,000 and returns $0.73 of interest at maturity. The Treasury also sells cash management bills at irregular times, but only through banks, brokers and dealers.
Treasury notes and bonds
Notes and bonds are the coupon securities. Both pay a fixed rate of interest every six months until maturity, and both can be stripped into separate principal and interest pieces. Notes run from two to ten years and bonds run twenty or thirty years. The ten-year note is the maturity most often quoted as the benchmark for mortgage and corporate borrowing rates.
Treasury Inflation-Protected Securities
TIPS differ from every other Treasury in one respect: the principal is not fixed. It rises with inflation and falls with deflation according to the Consumer Price Index published by the Bureau of Labor Statistics. The coupon rate is fixed at auction, but because it is applied to the adjusted principal, the dollar amount of each payment changes. At maturity you receive the inflation-adjusted principal or the original principal, whichever is greater, so deflation cannot take you below your starting amount. TreasuryDirect also notes that changes in principal during the year may affect your federal taxes even though you do not receive that money until maturity, and that TIPS auctions allow bids at negative real yields.
Floating Rate Notes
FRNs are two-year notes whose interest rate is the sum of an index rate and a spread. The index is the highest accepted discount rate at the most recent 13-week bill auction, which happens every week, so the rate resets weekly. The spread is fixed at the FRN's first auction and does not change for the life of the note. Interest is paid every three months. FRNs suit an investor who wants Treasury credit quality with an income stream that follows short-term rates rather than one locked in at purchase.
How Prices and Yields Are Set
All marketable Treasuries are sold at auction in four steps described on TreasuryDirect: the Treasury announces the offering, holds the auction, accepts bids, and issues the securities. Individual investors normally submit non-competitive bids, which accept whatever yield the auction produces, with a limit of $10 million per auction. Competitive bidders specify the yield they will accept and may be awarded up to 35% of the offering.
For notes and bonds the auction determines the yield to maturity, and the coupon rate is then set at the nearest eighth of a percent at or below that yield. TreasuryDirect spells out the consequence: if the yield is higher than the coupon, the price is below par; if they are equal, the price is par; if the yield is lower, the price is above par. Its example is a 20-year bond auctioned at a 1.850% yield with a 1.750% coupon, which priced at 98.336995 per 100 of face value. The buyer earns the coupon on par plus the discount at maturity.
Once issued, a Treasury's price moves inversely with market yields. If yields rise, existing securities with lower coupons fall in price so that a new buyer earns the current market yield, and the longer the remaining maturity, the larger the move. Held to maturity, none of this matters, because face value is paid regardless. Sold early, it does.
Reading the Treasury Yield Curve
Investor.gov defines the yield curve as a graph of yields on debt across maturities from three months to 30 years. For Treasuries the reference version is the Daily Treasury Par Yield Curve published by the Treasury each business day, and the Federal Reserve's H.15 release reports the same constant-maturity yields. Because Treasuries carry the same credit quality at every maturity, the curve isolates how the market prices time.
| Curve shape | What it means | How it is measured |
|---|---|---|
| Normal, or upward sloping | Longer maturities yield more than shorter ones, compensating for the extra time and interest-rate exposure | Ten-year yield minus two-year yield is positive |
| Flat | Short and long yields are close together | Spreads near zero |
| Inverted | Short maturities yield more than long ones | Ten-year minus two-year, or ten-year minus three-month, turns negative |
The LuxAlgo Library's yield curve entry describes the two spreads most often watched, ten-year minus two-year and ten-year minus three-month, and treats a change in the curve's shape as information about the interest-rate regime rather than as a timing signal. Inversions have preceded past recessions, which is why they draw attention, but the lag between inversion and any downturn has varied widely and the curve says nothing about how stocks will behave in the meantime. Use it as context for how much you are paid to extend maturity.
Risks That Still Apply
Investor.gov's bond guidance lists five risks for any fixed-income investment. Treasuries remove one and reduce another, but the rest remain.
- Credit risk: the risk that the issuer misses a payment. For Treasuries this is the risk the market treats as the baseline for everything else.
- Interest-rate risk: if you sell before maturity, the price may be above or below face value depending on where yields have moved. The longer the maturity, the larger the swing for a given yield change.
- Inflation risk: a fixed coupon buys less if prices rise. TIPS address this directly; bills address it indirectly by rolling into new rates quickly.
- Liquidity risk: the risk of not finding a buyer. Treasuries are among the most actively traded securities in the world, so this risk is small for the securities themselves, though it can matter for a fund holding them.
- Call risk: the risk an issuer redeems early when rates fall. Treasuries issued today are not callable, so this risk does not apply.
One more practical point: reinvestment risk. When a short bill matures, the proceeds are reinvested at whatever rate prevails, which may be lower. That is the price of the flexibility that makes bills attractive when rates are rising.
Three Ways to Hold Treasuries
Building a Treasury ladder
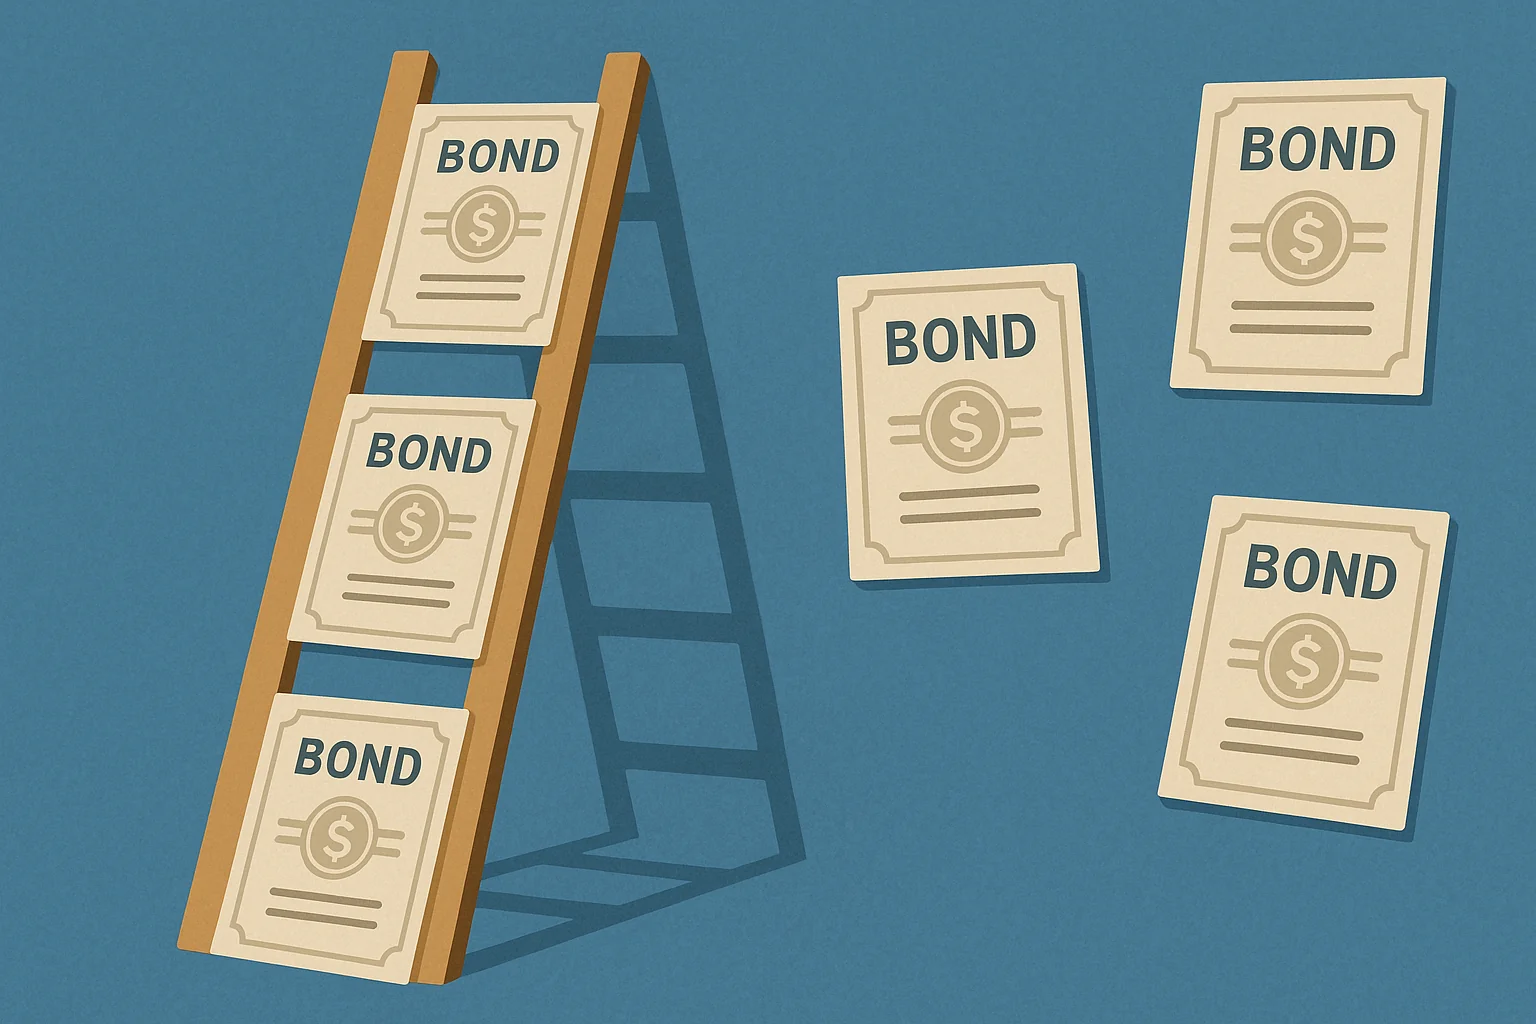
A ladder divides the money among securities that mature at staggered dates, for example equal amounts in one-, two-, three-, four- and five-year notes. Each year one rung matures and is reinvested at the long end of the ladder. The result is a portfolio whose average maturity stays roughly constant, whose reinvestment happens in small steps rather than all at once, and which always has a rung close to maturity if cash is needed. A ladder does not predict rates; it makes the outcome less dependent on any single auction.
The barbell
A barbell holds only the two ends of the maturity range: bills or short notes for liquidity and rate flexibility, and long bonds for the higher coupon and the larger price response if yields fall. The middle maturities are left out. Compared with a ladder of the same average maturity, a barbell has more of its value concentrated in the long rung, so it gains more if long yields drop and loses more if they rise. Investors who use it typically rebalance the two ends as their outlook changes.
TIPS as an inflation hedge
Adding TIPS shifts part of the fixed-income allocation from nominal to real terms. The coupon is small, so the value of the position comes from the principal adjustment. Because the adjustment is taxed federally in the year it accrues even though it is not paid until maturity, many investors prefer to hold TIPS in tax-advantaged accounts. TreasuryDirect accounts cannot hold retirement accounts, so TIPS destined for an IRA are bought through a broker or through a TIPS fund.
Where Quant Charts Fits
Quant Charts does not chart individual Treasury securities, and no LuxAlgo tool buys, sells or holds them; purchases go through TreasuryDirect, a bank or a broker. What Quant Charts does cover is the exchange-traded fund layer. Its US equities feed from Cboe EDGX includes ETFs listed on US exchanges, so a short-bill fund, an intermediate Treasury fund, a long-bond fund and a TIPS fund can each be charted next to the stocks or indices they are meant to balance. Three uses follow from that.
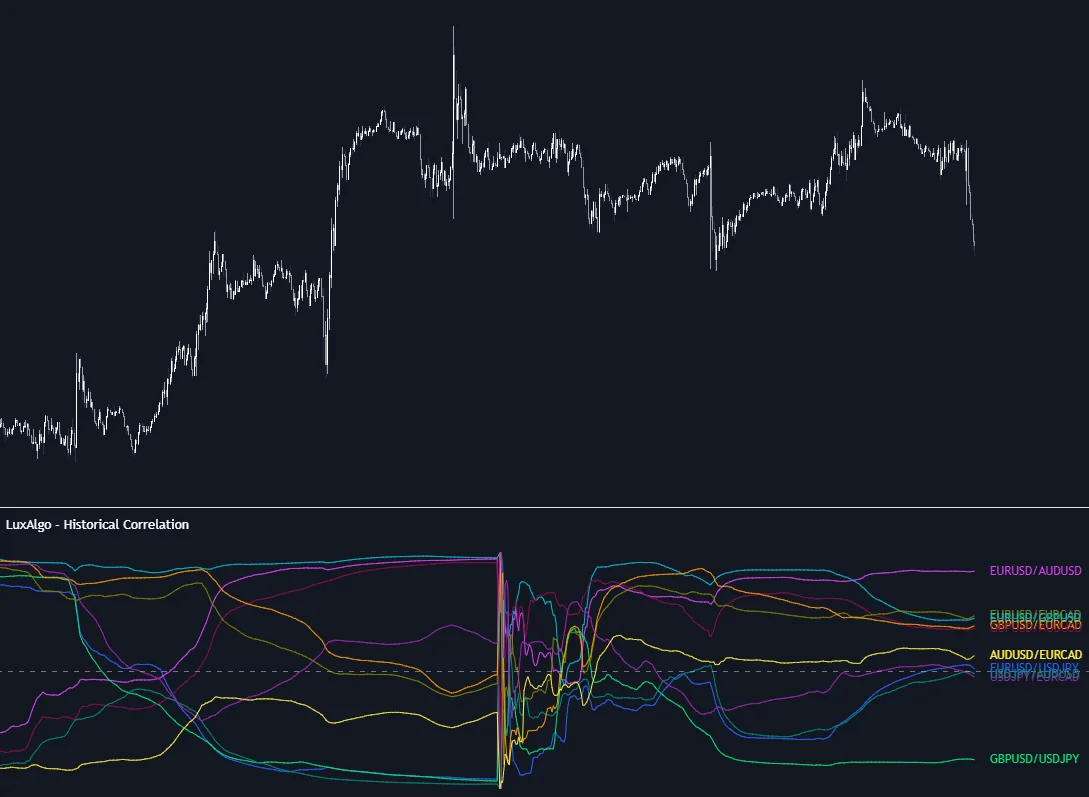
Measure the stock-Treasury relationship instead of assuming it. The Library's correlation and intermarket analysis entries make the same point: the correlation between stocks and bonds has changed sign across decades, and correlations across risk assets tend to rise in stress. The Historical Correlation indicator tracks the coefficient for up to ten ticker pairs from an anchor bar you choose, as evolving lines or a heat map, so you can see whether a long-bond fund has been offsetting your equity holdings recently or moving with them.
Keep the whole ladder on one watchlist. A watchlist can hold the Treasury ETFs by maturity bucket beside the equity positions they sit against. The Advanced watchlist adds Price, Financials and News tabs and an Allocation panel, so the weight of the fixed-income sleeve is visible without leaving the chart.

The video below shows how a watchlist is created in Quant Charts.
Test a rotation rule before trusting it. Describe a rule to Quant, our coding agent, in plain language, for example holding an equity index fund while it closes above its 200-day moving average and switching to a Treasury fund when it closes below. Quant writes the Pine Script; open Code to inspect it, then click Run. The Backtest Summary reports net profit, trade count, win rate, max drawdown and profit factor. Set commission and slippage in the strategy's Properties so the switching cost is included, and compare the max drawdown with what you would tolerate. The Library's drawdown statistics entry explains how to read that figure. If you then act on the rule through a broker, the Journal can hold the record of each switch in a manual account with a starting balance you set.
FAQs
What are U.S. Treasury securities?
Debt obligations of the U.S. Department of the Treasury. The marketable types are bills, notes, bonds, TIPS and Floating Rate Notes, all sold at auction with a $100 minimum, tradable before maturity, and backed by the full faith and credit of the U.S. government.
How do Treasury bills differ from notes and bonds?
Bills mature in 52 weeks or less and pay no coupon; you buy below face value and receive face value at maturity. Notes mature in two to ten years and bonds in 20 or 30 years, and both pay a fixed coupon every six months set at auction and never below 0.125%.
How do TIPS protect against inflation?
Their principal is adjusted with the Consumer Price Index, and the fixed coupon is paid on the adjusted principal. At maturity you receive the adjusted principal or the original principal, whichever is greater, so deflation cannot reduce the amount below what you paid.
Are Treasuries taxed?
Interest is subject to federal income tax but exempt from state and local income tax. For TIPS, increases in principal are also federally taxable in the year they occur, which is one reason investors often hold TIPS in tax-advantaged accounts.
What does an inverted yield curve mean?
Short-term Treasury yields exceed long-term yields, so the ten-year minus two-year or ten-year minus three-month spread is negative. Inversions have preceded past recessions, but the lead time has varied and the curve is best read as information about the rate regime rather than a timing signal.
Can I chart Treasuries in Quant Charts?
Not the securities themselves, but Treasury ETFs listed on US exchanges are included in the Cboe EDGX equities feed on every plan. You can chart them beside stocks, measure their correlation with Historical Correlation, hold them on an Advanced watchlist, and have Quant backtest a rotation rule. Quant Charts does not buy or hold Treasuries.
References
LuxAlgo Resources
- Yield Curve, Correlation and Intermarket Analysis concepts (LuxAlgo Library)
- Historical Correlation indicator and Drawdown Statistics concept (LuxAlgo Library)
- Quant Charts market data and Advanced watchlist (LuxAlgo Docs)
- Making strategies with Quant, Reading a strategy backtest and Journal (LuxAlgo Docs)
External Resources
- Treasury Bills, Treasury Notes and Treasury Bonds (TreasuryDirect)
- Treasury Inflation-Protected Securities and Floating Rate Notes (TreasuryDirect)
- Understanding Pricing and Interest Rates and How Auctions Work (TreasuryDirect)
- Daily Treasury Par Yield Curve Rates (U.S. Department of the Treasury)
- H.15 Selected Interest Rates (Federal Reserve Board)
- Treasury Securities and Yield Curve glossary entries (Investor.gov)
- Bonds: benefits and risks (Investor.gov)
Read next