Concept
Drawdown Statistics
Drawdown Statistics, also known as max, average, duration, recovery factor, are Performance, Backtesting & Validation concepts. The Library holds 1 implementation, a working definition you can pull into Quant.
Top Drawdown Statistics indicator
The top custom implementation, built on the original standard Drawdown Statistics formula.
1 total
Want to trade Drawdown Statistics? The implementation below is one prompt away from a backtested strategy in Quant.
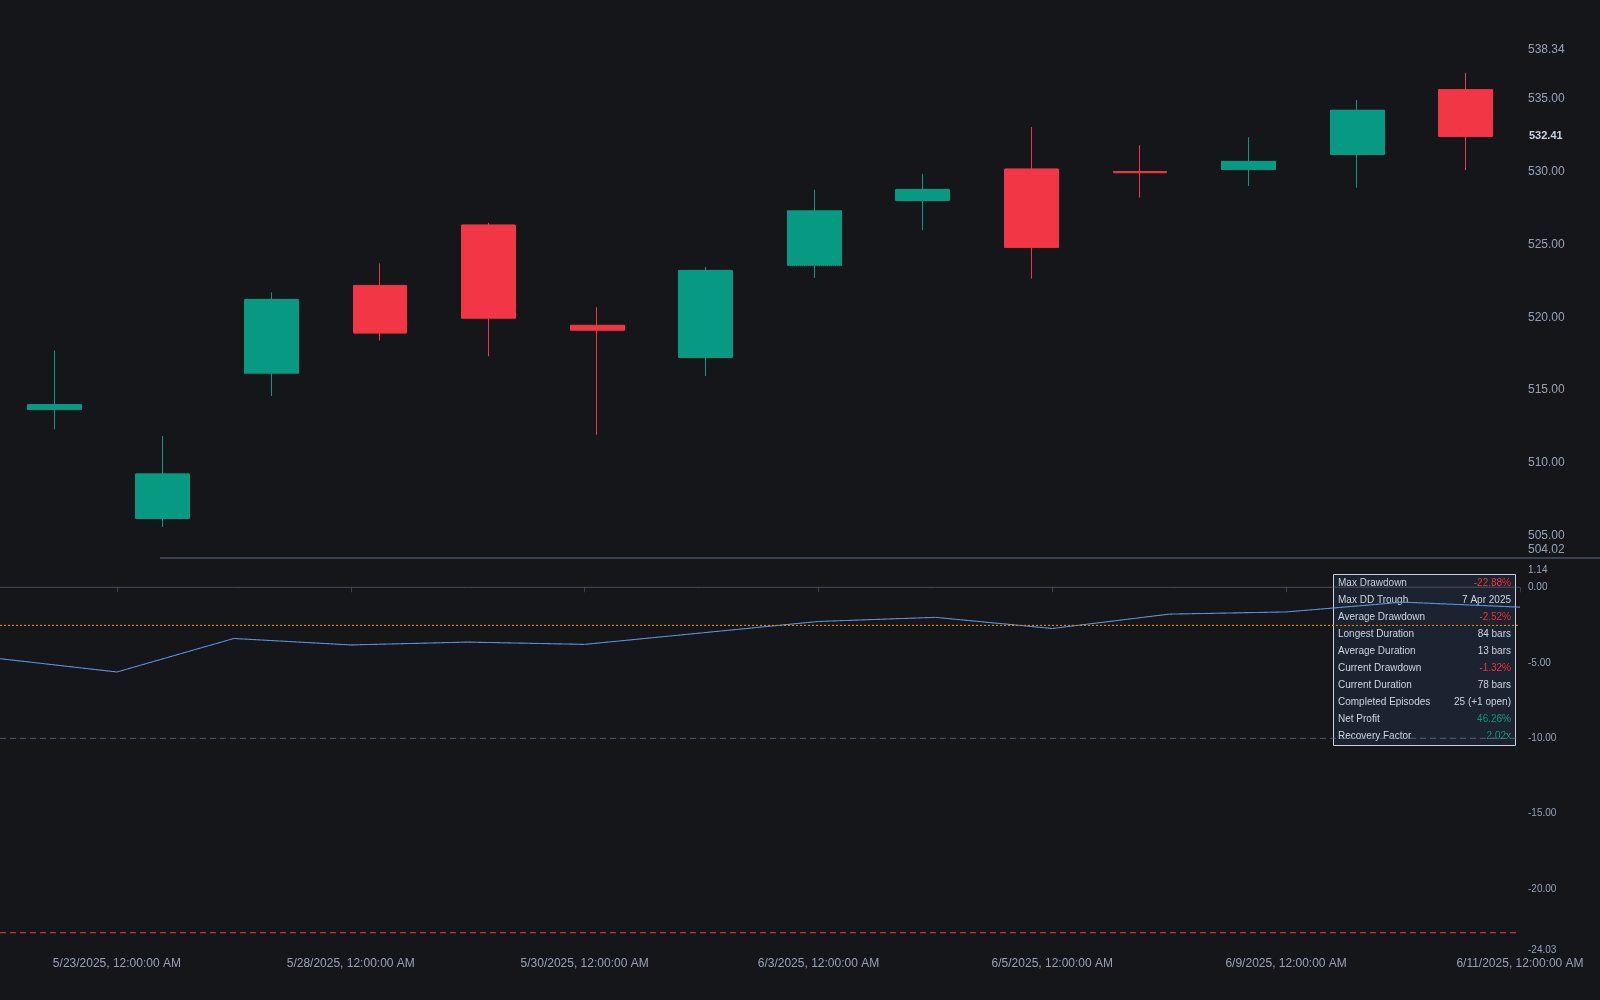
What are drawdown statistics?
Drawdown statistics describe the declines of an equity curve from its running peak: how deep the losses went, how long they lasted, and how quickly the account recovered. The core figures are maximum drawdown (the single worst peak-to-trough loss), average drawdown (the typical depth across all drawdown episodes), drawdown duration (time from a peak until that peak is regained), and the recovery factor (net profit divided by maximum drawdown). Together they profile the downside experience of a strategy far more concretely than volatility does.
These statistics exist because compounding is path dependent. A 50 percent drawdown requires a 100 percent gain to recover, so deep holes are disproportionately destructive; and drawdowns, not standard deviation, are what break traders psychologically, trigger fund redemptions, and violate prop-firm loss limits. Duration matters as much as depth: many traders abandon sound systems not because the hole was deep but because it lasted a year.
Practitioners care because nearly every drawdown-aware performance measure is built from these numbers, including the Calmar ratio, the Ulcer Index, and the Martin ratio. The honest caveat is that a backtest's maximum drawdown is a single realization: the live worst case is usually worse, because the historical window simply has not yet contained the strategy's true tail.
How it's calculated
All drawdown statistics derive from the running-peak decline series of the equity curve.
Drawdowns can be stated in percent or currency; percent is standard for comparability.
Intrabar or intraday equity marks produce deeper drawdowns than end-of-day or closed-trade accounting; be consistent when comparing.
How traders use it
- Position sizing: expected maximum drawdown scales roughly with size, so traders back into an acceptable risk level by asking what multiple of the historical drawdown they could survive, often alongside risk of ruin estimates.
- Strategy monitoring: a live drawdown that exceeds the historical maximum in depth or duration is a common, if blunt, trigger for review or shutdown, and feeds equity-curve throttling rules.
- Robustness work: because one historical max drawdown is a weak estimate, practitioners use resampling of trade sequences to build a distribution of plausible drawdowns rather than relying on the single observed path.
- Expectation setting: average drawdown and typical duration tell a trader what normal feels like, so ordinary rough patches are not mistaken for system failure.
- Limitations: all of these figures are backward looking, sensitive to window choice, and systematically optimistic for strategies with rare tail events that the sample happened to miss.
Drawdown statistics vs. related concepts
Ulcer Index: The Ulcer Index compresses the whole drawdown series into one number by root-mean-squaring the depths, weighting deep and prolonged drawdowns heavily. Drawdown statistics are the underlying raw measurements.
Standard Deviation: Standard deviation measures dispersion around the mean and treats gains and losses symmetrically; drawdown statistics measure only cumulative declines from peaks, which is closer to how losses are actually experienced.
Risk of Ruin: Risk of ruin is a forward-looking probability of hitting a fatal loss threshold; drawdown statistics are the historical record that such models are calibrated against.
Concept family
Performance, Backtesting & Validation
30 concepts mapped · 30 in the Library
Drawdown Statistics FAQ
Turn Drawdown Statistics into a trading strategy.
Take the implementation from this page into Quant, then build on it, backtest it on real data, and keep refining it in conversation.