Seasonality Widget
 By LuxAlgoMay 14, 2024
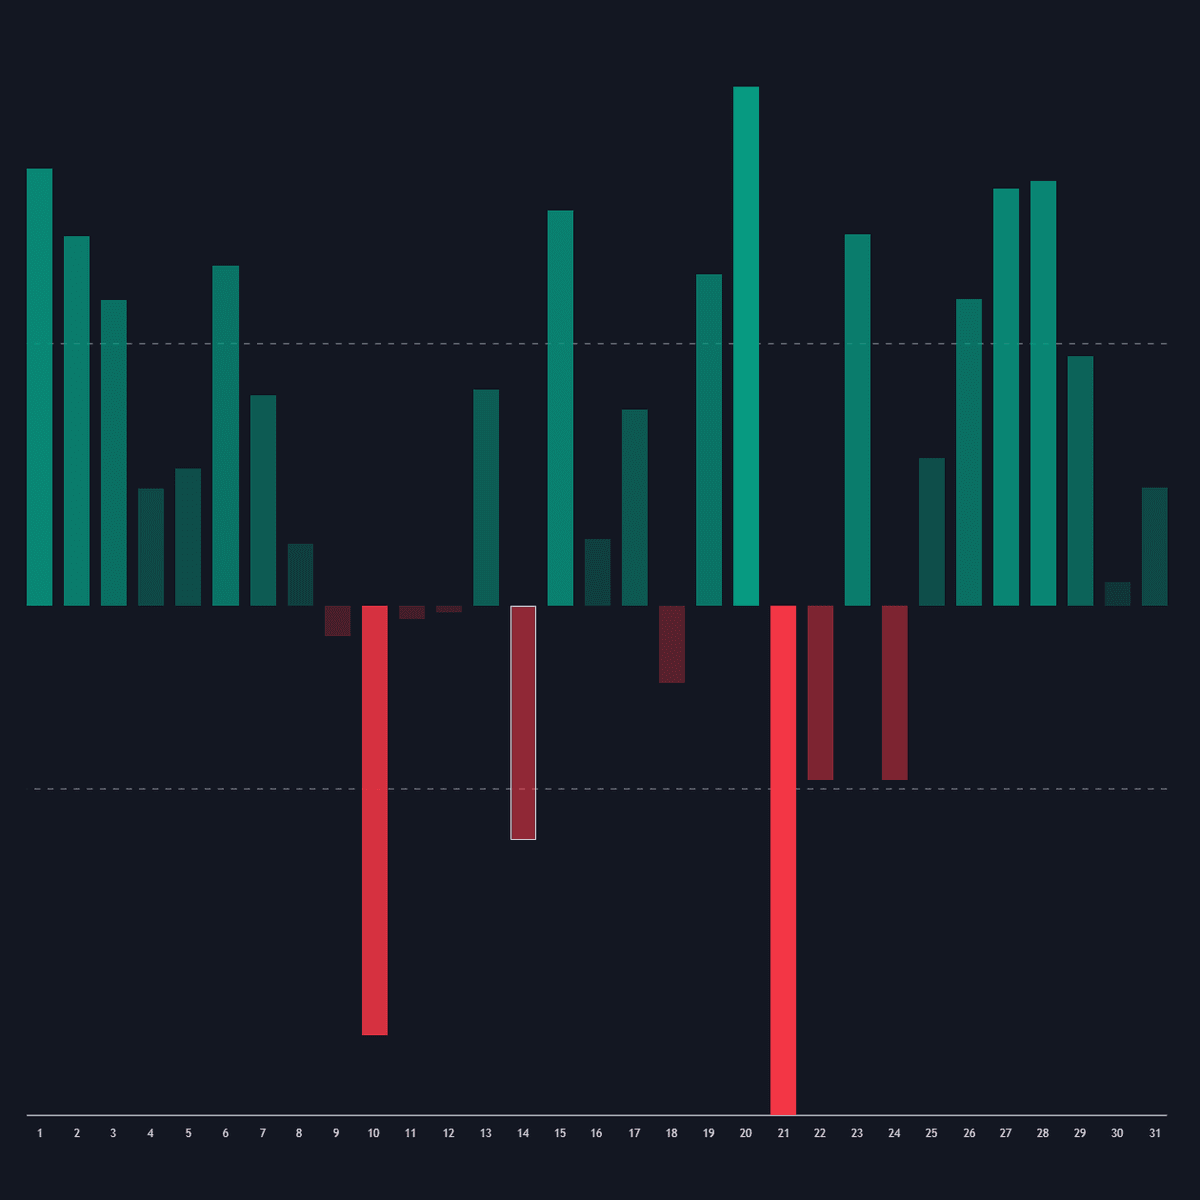
Seasonality Widget answers a blunt question: at this hour, on this weekday, in this month - what does this market usually do? Choose a granularity (Hour, Day Of Week, Day Of Month, Month, or Day Of Year) and the widget groups every observation since your chosen start date into buckets, then summarizes each bucket with the statistic you pick. It is a general-purpose piece of seasonal-analysis tooling: the same machinery profiles an hourly rhythm in crypto, a weekday tilt in an index, or a monthly pattern in a commodity.
How to Trade the Seasonality Widget?
- Choose the series: Price Change (absolute, percent, or sign), Range, Price - SMA, Volume, or Volume - SMA. Sign mode is normalized to 0-100, where readings above 50 mean positive changes outnumber negative ones.
- Pick the statistic: Mean, Median, Max, Min, or Max-Min Average - the median resists outliers, while max and min bound each bucket's extremes.
- Filter the sample: set a Filter Granularity and list comma-separated values in the Numerical Filter Input to exclude them; entering a year such as 2008 drops it from every bucket.
Hourly buckets reveal which hours of the day have historically carried the movement; weekday buckets do the same for day-of-week effects; monthly buckets sketch the shape of the year.
Seasonality Widget Settings
- Granularity: the period data is grouped by.
- From Date: the first date included in the sample.
- Analyze: the data series fed into the buckets.
- SMA Length: the moving-average period behind Price - SMA and Volume - SMA.
- Statistic: the summary applied to each bucket.
- Filter Granularity / Numerical Filter Input: the period type to exclude and the specific comma-separated values to drop.
Frequently Asked Questions
Free indicator
Get free access to this indicator on the platforms below.

The Library is free. Quant makes it yours.
Pull any concept or indicator into Quant: rebuild it, retune it, or turn it into a backtested strategy of your own.