Concept
Month-of-year Seasonality
Month-of-year Seasonality, also known as September weakness, return matrices, is a Time, Sessions & Seasonality concept. The Library holds 3 implementations, each one a working definition you can pull into Quant.
Top Month-of-year Seasonality indicators
The top custom implementations, built on the original standard Month-of-year Seasonality formula.
3 total
Every Month-of-year Seasonality implementation here is strategy-ready: open one in Quant, set your rules, and it backtests automatically.
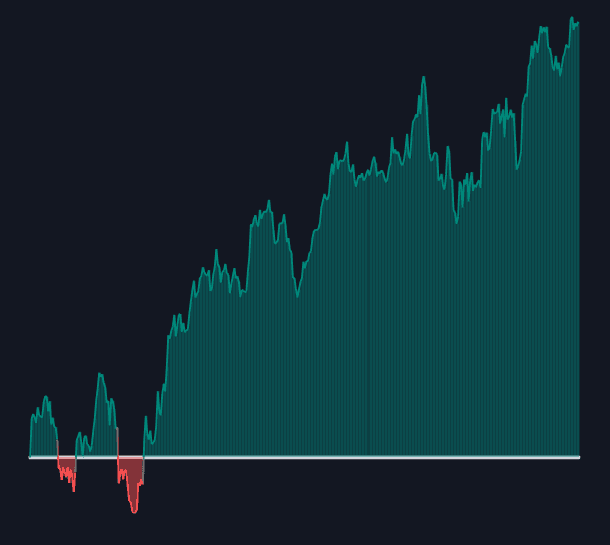
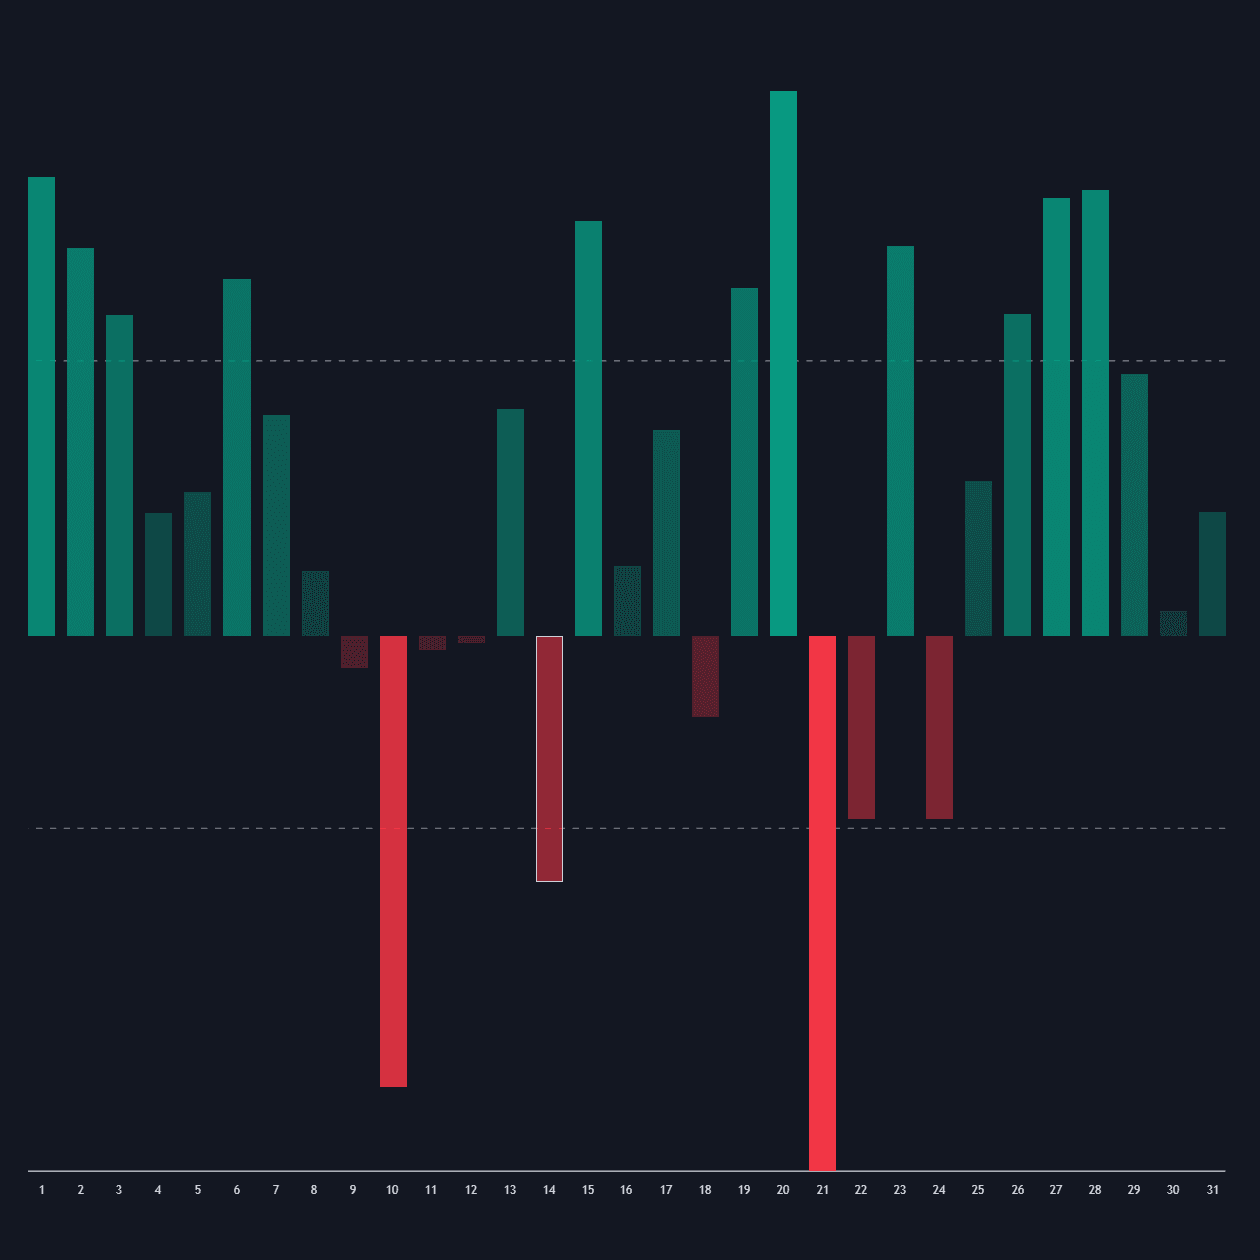
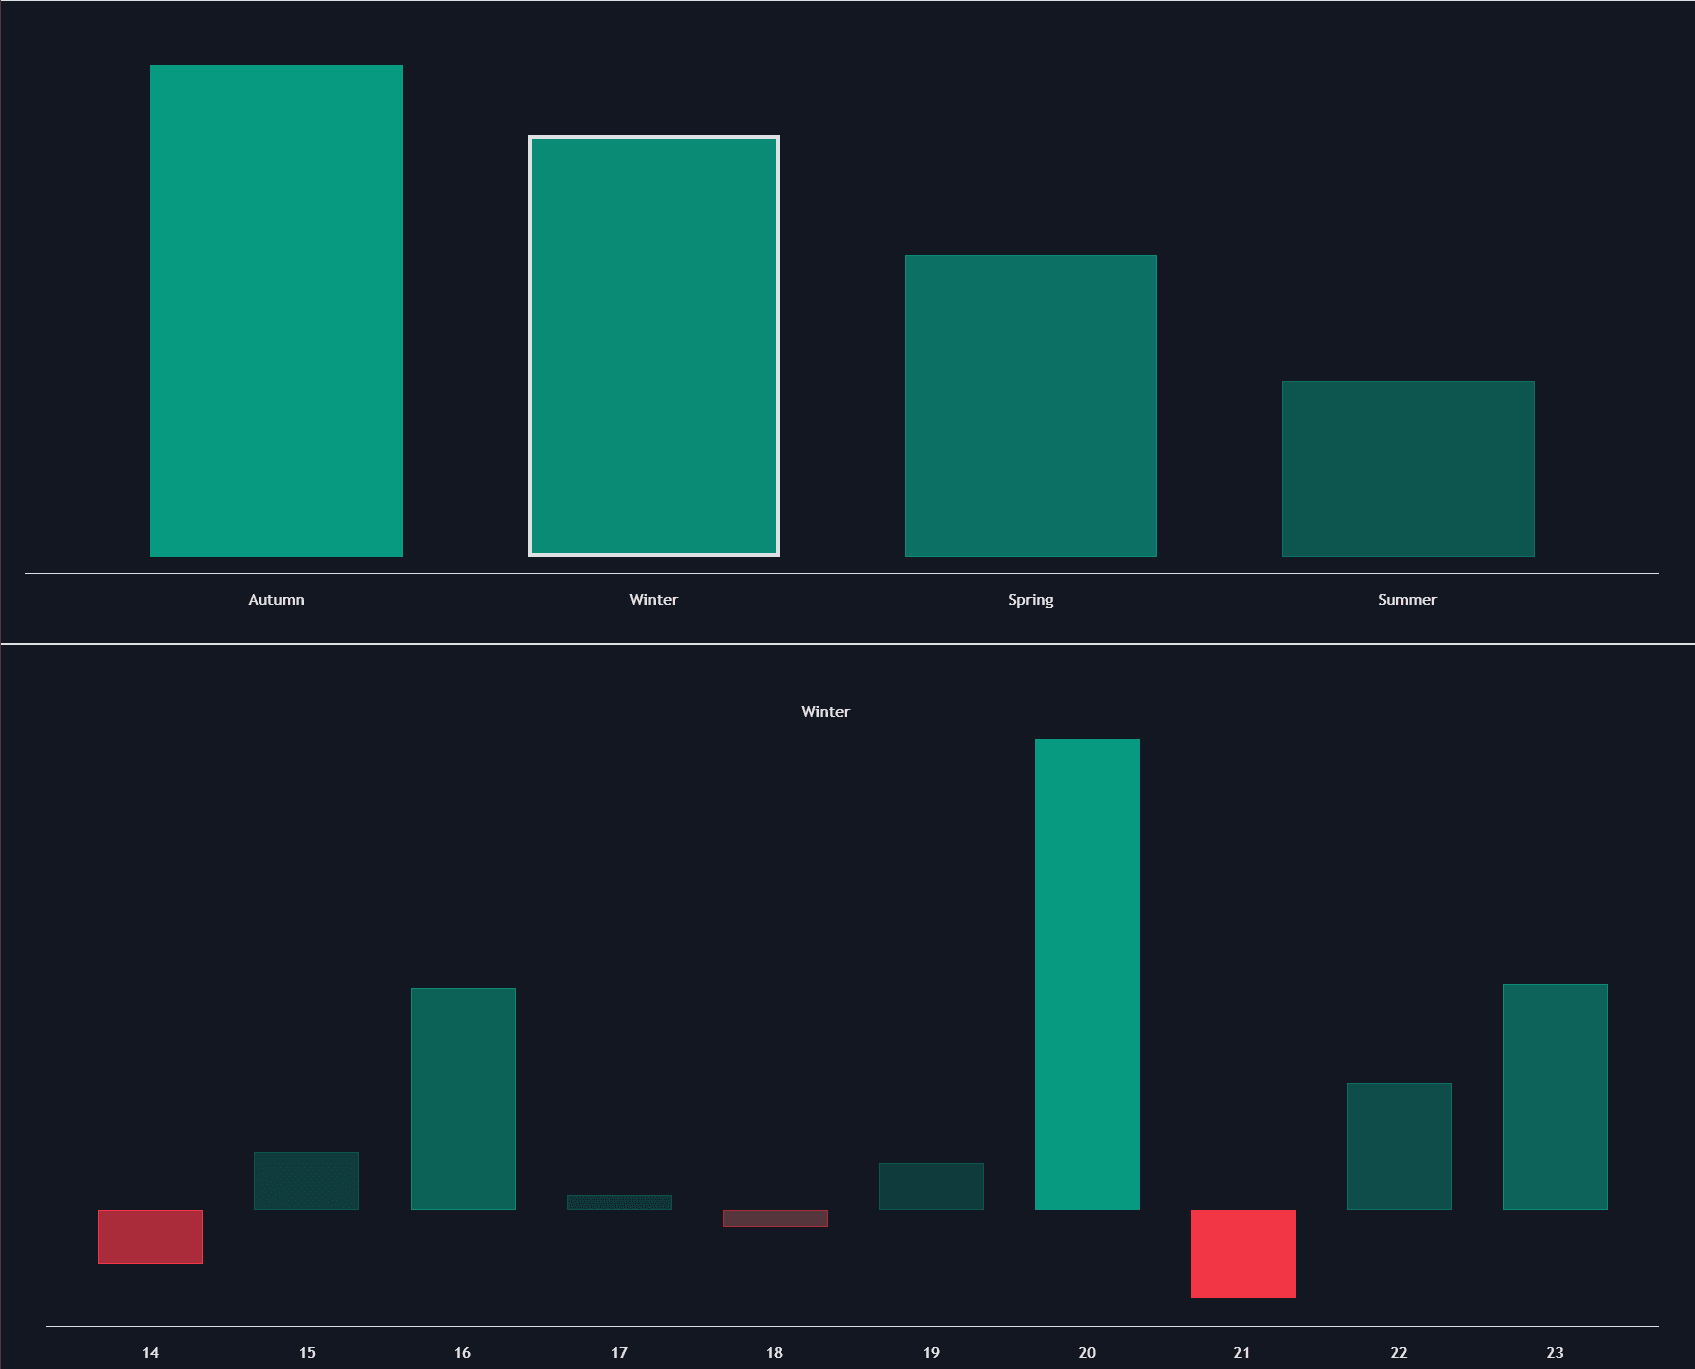
What is Month-of-year Seasonality?
Month-of-year seasonality is the tendency for average returns to differ by calendar month, measured by laying years of monthly returns into a matrix (years down the rows, months across the columns) and summarizing each column with an average and a hit rate. The equity folklore lives here: September's historically weak average in major US indexes, 'sell in May', the Santa Claus rally, the January effect in small caps. Some of these are visible in long samples; all of them are averages with wide dispersion around them.
The study of calendar effects is nearly as old as index data. Sidney Wachtel flagged January strength in small stocks in a 1942 paper, Rozeff and Kinney's 1976 study made the January effect an academic fixture, and 'sell in May' descends from much older London market lore. The later chapters matter just as much: several celebrated effects weakened or vanished after publication, which is the standing warning attached to every seasonal average.
Its value is as a base rate. A monthly average over twenty years rests on twenty observations, outlier years can dominate a column, and widely publicized effects have historically weakened after publication. That is why seasonality tooling pairs each monthly average with a consistency score, and why the output is a tilt on top of price analysis rather than a standalone signal.
Reading a matrix well is mostly sample discipline. An average means little without its hit rate (how many years the month closed the same way) and its dispersion (whether one crash year is doing the talking); a split sample, folklore-era versus the recent decade, shows whether the tilt still exists; and instrument specificity is non-negotiable, since commodity calendars follow harvests and inventories, and crypto's short history barely supports monthly columns at all.
How to read a month-of-year seasonality matrix
Seasonality tools render as return matrices or monthly bar profiles; the reading is sample-size skepticism applied twelve times.
- 1Check the sample first: which years the matrix spans and how many observations each monthly column actually contains.
- 2Read average and hit rate together: a +1% average month that closed higher in 6 of 20 years is an outlier artifact, not a tendency.
- 3Scan the column's dispersion for dominating years; one crisis October can manufacture a phantom effect on its own.
- 4Split the sample and compare: a tilt present in the full history but absent in the last decade is folklore in the process of expiring.
- 5Keep the matrix instrument-specific: index folklore does not transfer to commodities or crypto, and each symbol earns its own columns.
How traders use it
- Tilting expectations: sizing more conservatively or demanding better setups in a symbol's historically weak months, without letting the calendar overrule live price action.
- Building the matrix per instrument: commodities follow harvest and demand calendars, and crypto's four-year halving folklore belongs with long-horizon calendar cycles; equity folklore does not transfer, so each market earns its own return matrix.
- Auditing strategies: if a backtest's edge concentrates in one or two calendar months across the sample, that is concentration risk worth knowing before committing capital.
- Stacking calendars: monthly tilts combine with day-of-week effects and fixed time cycles into one calendar view, with each layer held to the same sample-size standard before it earns weight.
- Scheduling around known catalysts: a month's tilt often traces to recurring macro event days inside it (earnings seasons, fiscal year-ends, index rebalances), and knowing the mechanism turns a bare average into a testable hypothesis.
Month-of-year seasonality vs other calendar reads
Day-of-week Effects: Same matrix method on a faster clock: columns are weekdays instead of months, samples are hundreds of observations instead of tens. The statistics firm up while the effect sizes shrink, the usual trade in calendar work.
Long-horizon Calendar Cycles: Presidential cycles, decennial patterns, and crypto's halving rhythm live at multi-year scale with single-digit sample sizes. Monthly seasonality is the middle clock: thin samples by statistical standards, rich ones by comparison.
Fixed Time Cycles: Fixed cycles count bars from anchors and project rhythmic turn windows regardless of the calendar. Month-of-year work is strictly calendar-aligned averaging, no anchors, no projection, just conditional base rates per column.
Concept family
Time, Sessions & Seasonality
32 concepts mapped · 32 in the Library
Month-of-year Seasonality FAQ
Turn Month-of-year Seasonality into a trading strategy.
Take any implementation from this page into Quant, then build on it, backtest it on real data, and keep refining it in conversation.