ATR Exceedance Probability Model
By LuxAlgoMay 19, 2026
The Volatility Exceedance Probability Model (VEPM) indicator is a statistical trading indicator designed to help traders measure when volatility is moving beyond normal market behavior. By comparing current volatility exceedance events against a long-term baseline, VEPM helps identify volatility spikes, potential trend continuation, volatility contraction, and broader market regimes such as Quiet, Normal, and High Volatility conditions.
How to Trade With the Volatility Exceedance Probability Model Indicator
The Volatility Exceedance Probability Model gives traders a structured way to analyze volatility instead of relying only on visual price movement. It helps separate ordinary market noise from statistically significant volatility events, which can be useful for building a trading strategy around breakouts, trend continuation, volatility expansion, or mean reversion.
This trading indicator focuses on “exceedance” events, meaning moments when price action or range behavior moves beyond ATR-based volatility thresholds. When these events become more frequent than usual, the model highlights that volatility may be expanding and that the market may be entering a more active trading environment.
Understanding the VEPM Oscillator
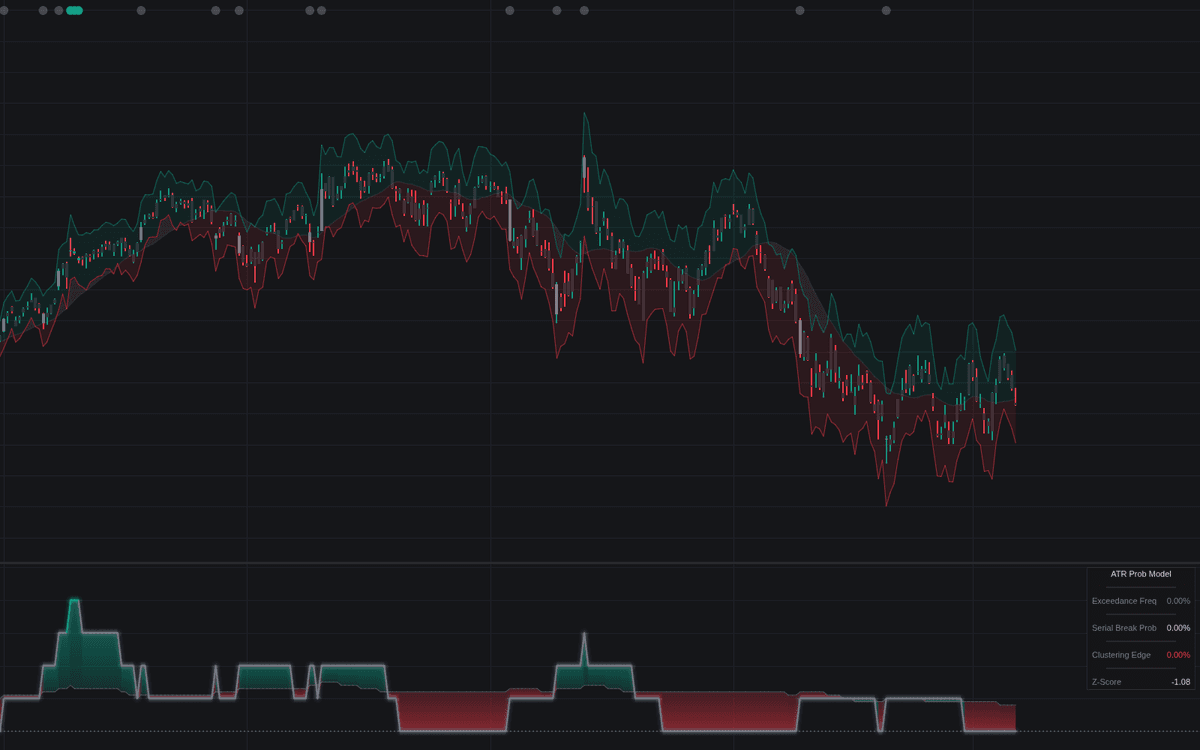
The main oscillator compares the current exceedance frequency against a longer-term volatility baseline. This allows traders to quickly see whether the market is behaving normally or entering an unusually active volatility phase.
- Bullish/Significant Glow: When the Z-Score of the exceedance frequency rises above the sensitivity threshold, the oscillator glows green. This suggests a statistically significant volatility expansion and may support breakout or trend continuation strategies.
- Bearish/Normal Glow: When the frequency falls below the baseline, the oscillator shifts toward red. This can signal volatility contraction, weaker momentum, or a quieter market environment.
- Frequency Delta: The filled area between the current frequency and baseline frequency shows whether volatility is expanding, slowing, or exhausting. A widening delta may indicate stronger volatility momentum, while a shrinking delta can suggest fading activity.
Reading Chart Visuals and Volatility Regimes
VEPM also overlays key volatility information directly on the price chart, helping traders connect statistical signals with real-time market structure.
- ATR Bands: Dynamic Average True Range bands act as the exceedance barrier. When price or range behavior breaches these bands, the indicator marks it as a volatility exceedance event.
- Regime Boxes: The indicator automatically classifies market conditions into Quiet, Normal, and High Vol regimes. These regime boxes help traders understand whether the current market favors patience, continuation setups, or volatility-based trading strategies.
- Significance Dots: Circles appear at the top of the chart when a bar breaches the volatility threshold. These dots make it easier to visually spot clusters of high-volatility activity.
High Volatility regimes may be useful for traders looking for breakout continuation, momentum trades, or aggressive trend-following conditions. Quiet regimes may be more useful for waiting, preparing for expansion, or avoiding low-quality signals in choppy markets.
Using the Dashboard Metrics
The VEPM dashboard provides real-time statistical context for traders who want a more quantitative trading indicator.
- Exceedance Freq: Shows the percentage of bars in the short-term window that breached ATR-based volatility levels.
- Serial Break Prob: Displays the historical probability that one breach is followed by another breach, helping traders estimate possible continuation.
- Clustering Edge: Measures the statistical advantage of volatility clustering. A positive value suggests that volatility is currently reinforcing itself, which may support continuation-based trading strategies.
These dashboard values can help traders confirm whether a volatility spike is isolated or part of a larger clustering pattern.
How the Volatility Exceedance Probability Model Works
The VEPM indicator is based on the idea that volatility often clusters over time. Markets do not usually move in a perfectly random rhythm; periods of low volatility are often followed by expansion, and periods of high volatility can continue as traders react to larger price movements.
The model uses statistical logic to detect when current volatility behavior becomes abnormal compared to historical conditions.
- Exceedance Detection: The indicator checks whether the current True Range or price levels exceed a user-defined ATR multiplier.
- Statistical Z-Score: VEPM compares the current exceedance frequency to a long-term baseline, set to 200 bars by default. This Z-Score helps determine whether current volatility is statistically unusual.
- Continuation Probability: The model reviews previous breach events and calculates how often they were followed by another breach, creating the Serial Break Probability metric.
This makes VEPM useful for traders who want a volatility trading indicator that combines ATR, probability, regime detection, and statistical significance into one complete toolkit.
Volatility Exceedance Probability Model Settings
Core Settings
- ATR Length: Controls the lookback period used for the Average True Range calculation.
- ATR Multiplier: Defines the volatility threshold required for a breach or exceedance event.
- Breach Detection Method: Allows traders to choose whether the model compares total bar range to ATR or checks whether price levels exceed the previous bar’s ATR bands.
Statistical Windows
- Short-Term Window: Sets the period used to calculate current exceedance frequency.
- Baseline Window: Sets the longer-term period used to establish the normal volatility frequency.
- Z-Score Sensitivity: Controls how sensitive the indicator is when identifying statistically significant volatility spikes.
Visual Settings
- Show ATR Bands: Toggles the visibility of ATR-based exceedance levels on the chart.
- Bands Mode: Determines whether bands are offset from a central basis, such as SMA or EMA, or from the bar’s High/Low.
- Regime Box Options: Enables or disables background boxes for Quiet, Normal, or High Volatility regimes.
Dashboard Settings
- Dashboard: Enables or disables the on-screen statistical dashboard.
- Position/Size: Controls the placement and scale of the dashboard UI.
FAQ
What is the Volatility Exceedance Probability Model indicator?
The Volatility Exceedance Probability Model is a statistical trading indicator that measures when volatility exceeds normal ATR-based thresholds. It helps traders identify volatility spikes, continuation probability, volatility clustering, and market regimes.
How can traders use VEPM in a trading strategy?
Traders can use VEPM to identify high-volatility expansion, potential breakout continuation, volatility contraction, and regime shifts. It can be combined with price action, support and resistance, trend indicators, or liquidity tools to improve market context.
What does Serial Break Probability mean?
Serial Break Probability measures how often a volatility breach is followed by another breach. A higher value suggests that volatility may be clustering and that continuation is more likely.
What are volatility regimes?
Volatility regimes classify the market into different conditions, such as Quiet, Normal, or High Volatility. These regimes help traders adjust their strategy depending on whether the market is calm, balanced, or highly active.
How do I access the Volatility Exceedance Probability Model indicator?
You can get access on the LuxAlgo Library for charting platforms like TradingView, MetaTrader (MT4/MT5), and NinjaTrader for free.
Free indicator
Get free access to this indicator on the platforms below.
The Library is free. Quant makes it yours.
Pull any concept or indicator into Quant: rebuild it, retune it, or turn it into a backtested strategy of your own.