Concept
ATR
ATR, also known as NATR / ATR %, is a Volatility concept. The Library holds 3 implementations, each one a working definition you can pull into Quant.
Top ATR indicators
The top custom implementations, built on the original standard ATR formula.
3 total
From studying ATR to trading it: take any implementation below into Quant and backtest it instantly.
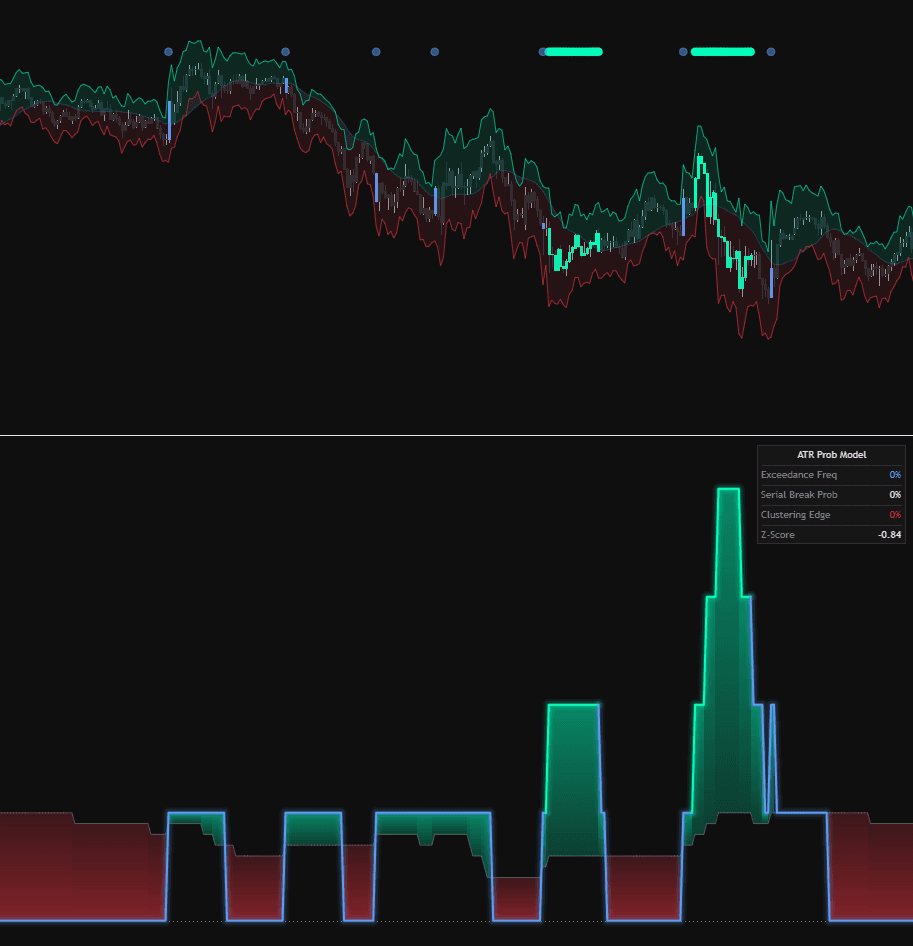
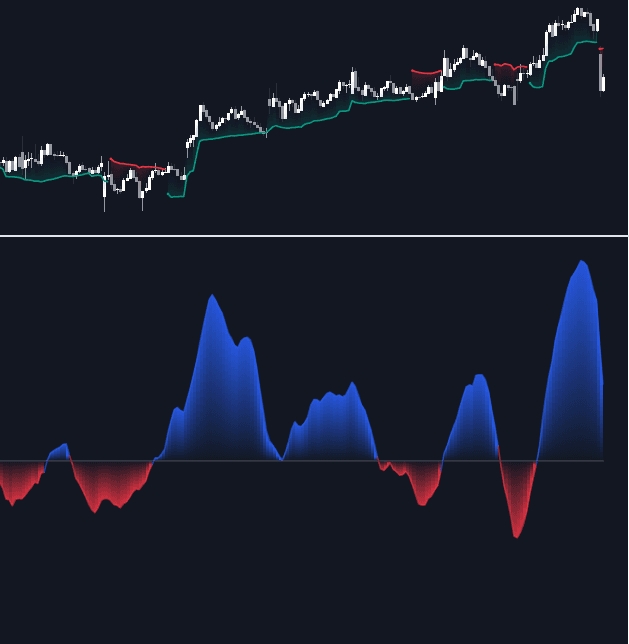
The standard ATR indicator
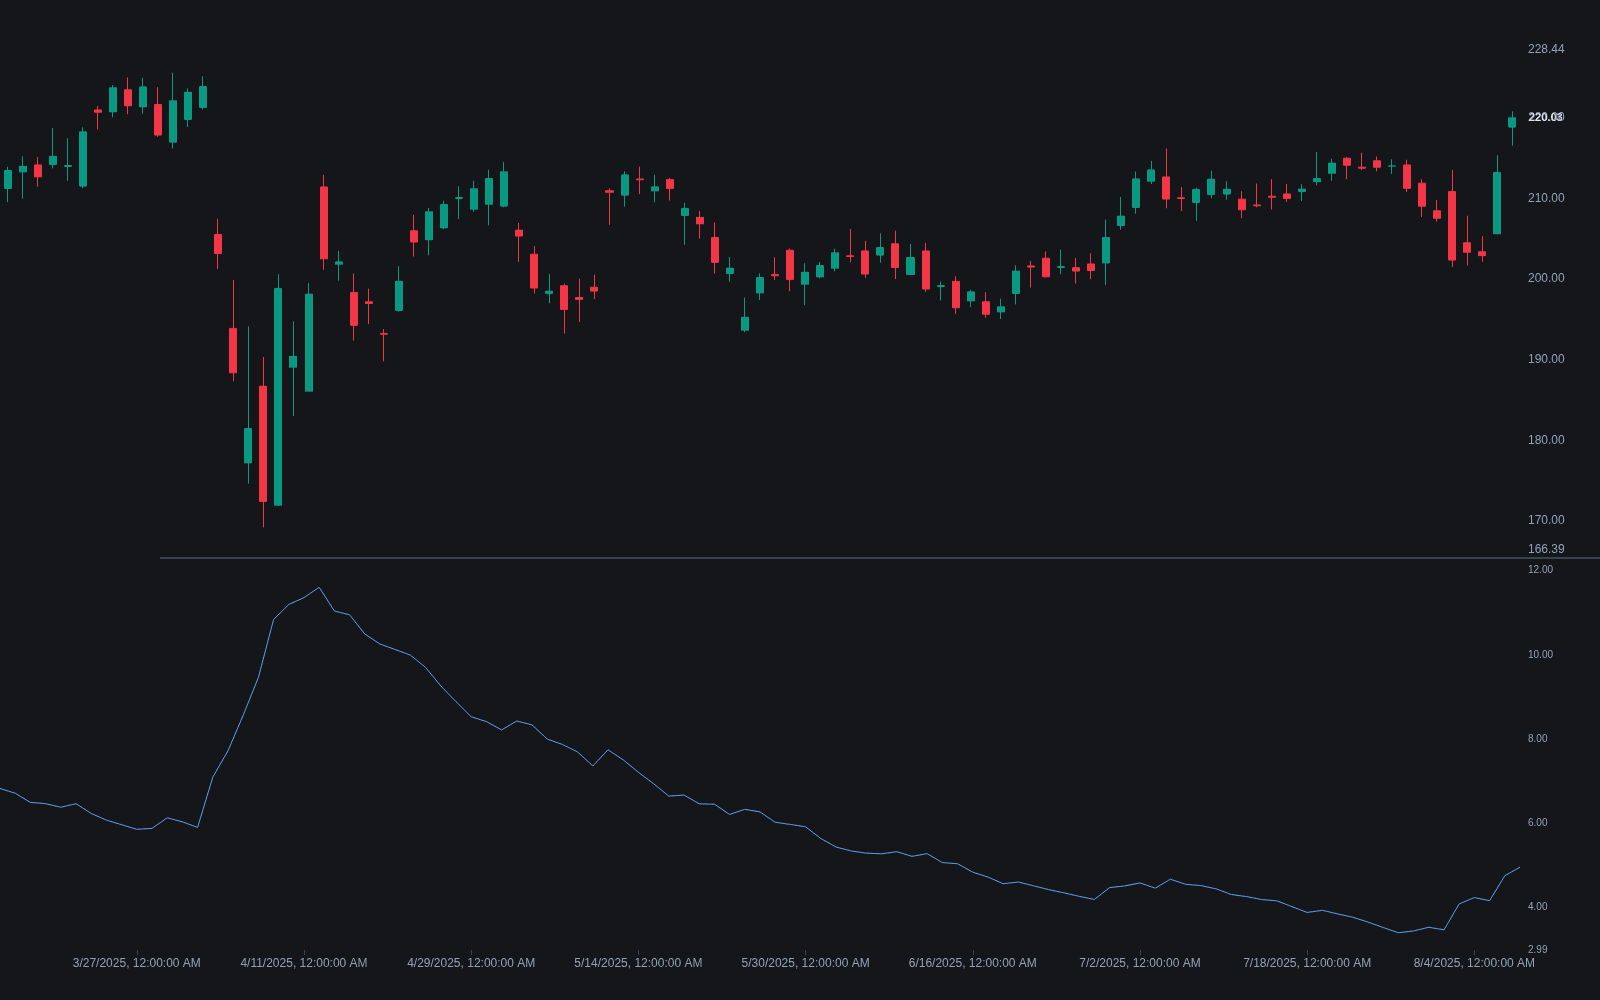
ATR exactly as classically defined: the faithful reference build of the original formula, free to run in Quant.
What is ATR?
ATR (Average True Range) is J. Welles Wilder's volatility measure, introduced in his 1978 book New Concepts in Technical Trading Systems. It begins with each bar's true range: the largest of high minus low, the absolute distance from the high to the prior close, and the absolute distance from the low to the prior close. Anchoring to the previous close counts gaps that a plain high-minus-low range would miss. ATR is true range averaged over a lookback, 14 periods in Wilder's original, using his own RMA smoothing.
Two properties govern the read. ATR is direction-blind: it measures how much price moves, not which way, so it rises in panicked selloffs as readily as in strong rallies. And it is denominated in price units, so a reading only means something relative to the instrument itself; dividing by price gives NATR (ATR percent), which makes volatility comparable across markets and across an instrument's own history.
ATR matters because it is the working unit of volatility in trading system design. Stops set in ATR multiples breathe with conditions instead of using fixed ticks, position sizes scaled to ATR keep risk broadly comparable across instruments, and a large family of tools builds on it, including Keltner Channels, Supertrend, and the Chandelier Stop. None of that makes it predictive on its own: ATR describes recent movement, and volatility regimes can shift abruptly.
How to calculate ATR
Everything flows from the true range of a single bar; ATR is its smoothed average.
- 1For each bar, compute true range: the greatest of high minus low, the absolute value of high minus the previous close, and the absolute value of low minus the previous close.
- 2Average true range over the lookback. Wilder used 14 periods with his RMA smoothing: current ATR equals the prior ATR times 13, plus the newest true range, divided by 14.
- 3Read the result in price units: an ATR of 2.50 on a 100-dollar stock means a typical bar's effective travel is about 2.5 percent of price.
- 4Check the smoothing before comparing across platforms: an SMA or EMA of true range at the same length responds faster than Wilder's RMA and prints different values.
How it's calculated
A smoothed average of the bar-by-bar true range, measuring volatility in price units with gaps included.
Line 2 is Wilder's smoothing (RMA), equal to an EMA with alpha = 1/n; platforms offering SMA or EMA smoothing instead print different values.
On the first bar of history there is no prior close, so TR_1 = H_1 - L_1.
ATR is in price units and not comparable across symbols; NATR (ATR percent) rescales it for comparison.
How traders use it
- For stop placement: setting initial and trailing stops a multiple of ATR beyond entry or structure scales the buffer to current conditions; the conventions live under ATR-based Stop Distance and the ATR Trailing Regime.
- For position sizing: fixing the cash risk per trade while the stop distance floats with ATR, the core of Volatility-targeted Sizing, makes a position in a quiet instrument and one in a wild instrument carry comparable practical risk.
- As a breakout filter: requiring a close beyond a level by a fraction of ATR, or a bar whose range exceeds an ATR multiple, screens out breakouts too small to distinguish from noise.
- As a regime gauge: rising versus falling ATR separates expansion from contraction phases (ATR Expansion/contraction), which adaptive systems use to switch parameters, widen targets, or stand aside.
ATR vs other volatility measures
ATR Bands: ATR is a scalar volatility reading; ATR Bands project that scalar around price or a moving average to make a tradable envelope. The bands inherit ATR's smooth, gap-aware character.
Close-to-close Historical Volatility: Historical volatility is the standard deviation of close-to-close returns, usually annualized. It sees only closing prices, ignoring the highs and lows inside each bar that true range includes, and it is expressed in percent terms where ATR is in price units.
BandWidth: BandWidth measures the spread of Bollinger Bands relative to their middle band, a normalized, standard-deviation-based gauge. ATR answers the same how-volatile question from bar ranges rather than the dispersion of closes.
ADX / DMI System: ADX, also Wilder's and also non-directional as a line, measures trend strength from directional movement. ATR measures raw movement regardless of whether it trends; a choppy market can have high ATR and low ADX at once.
Concept family
Volatility
57 concepts mapped · 57 in the Library
ATR FAQ
Turn ATR into a trading strategy.
Take any implementation from this page into Quant, then build on it, backtest it on real data, and keep refining it in conversation.