Average Daily Range
 By LuxAlgoAug 12, 2026
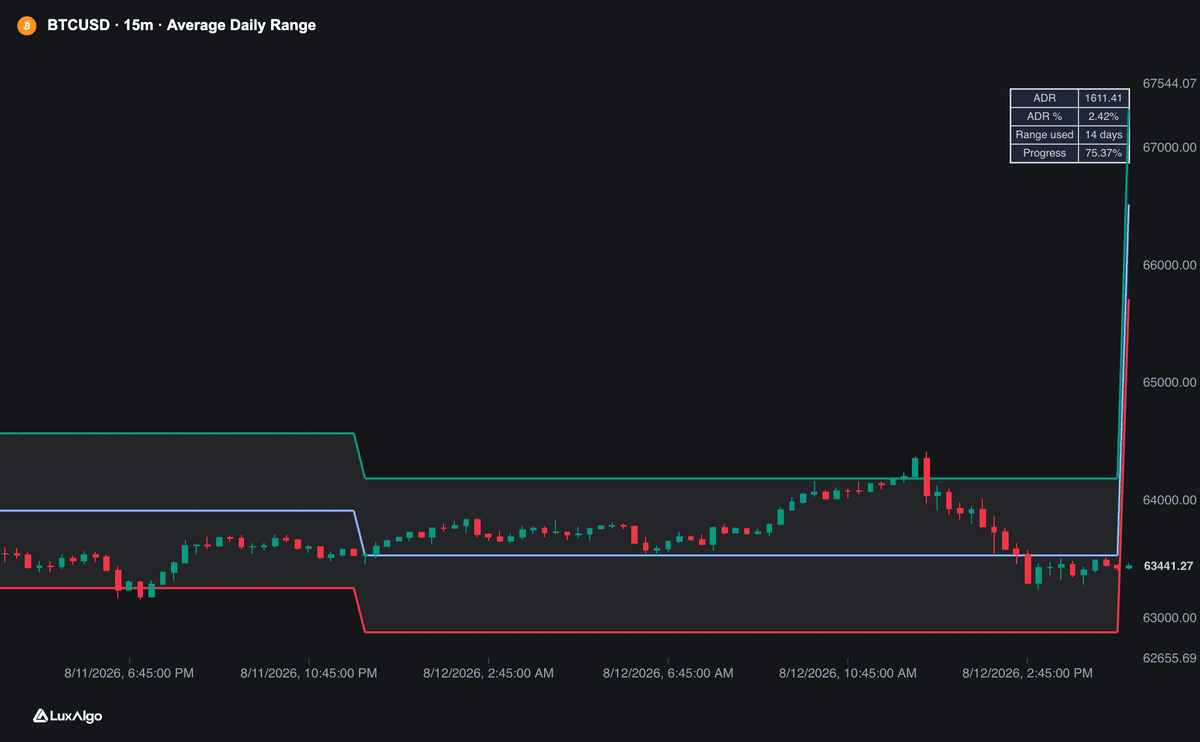

The Average Daily Range (ADR) is a powerful volatility tool that helps traders measure the expected movement of an asset over a typical daily session. By calculating the average distance between daily highs and lows over a specific lookback period, it projects potential price extremes from the current day's open. This indicator provides traders with critical context regarding market exhaustion, helping identify when price action may be overextended or approaching key pivot points.
How to Trade the Average Daily Range?
The ADR acts as a roadmap for daily price movement. One common strategy involves monitoring the projected ADR high and low levels as potential areas of interest for mean reversion. When price action approaches these boundaries, it often indicates the asset has exhausted its typical daily volatility, suggesting that a reversal or a period of consolidation may follow.
Traders also use the ADR to gauge the strength of a move. If price breaks through the projected ADR levels with strong momentum, it may signal a breakout or a significant shift in market trend rather than a simple exhaustion point. Furthermore, the indicator is highly effective for risk management. Many traders use these projected levels to set realistic profit targets for the day or to place stop-losses outside of the typical range to avoid getting stopped out by standard intraday noise. By observing the information table, you can quickly assess how much of the day's expected movement has already occurred, allowing for more informed entry and exit decisions.
Average Daily Range Settings
Calculation
- ADR Length: Defines the number of historical daily ranges used to calculate the average. A lower value makes the indicator more sensitive to recent market changes, while a higher value smooths out the calculation over a longer period.
- Range Basis: Allows you to choose between the standard daily candle or the regular session hours for the calculation, which is useful for traders focusing on specific market windows.
Display
- Show Daily Open: Toggles the display of the current session's opening price.
- Show ADR Midpoint: Enables the visibility of the midpoint line between the projected high and low.
- Show Information Table: Toggles the display of the summary table, which provides real-time data on ADR values and current range completion.
Style
- ADR High: Adjusts the color of the upper projected range boundary.
- ADR Low: Adjusts the color of the lower projected range boundary.
- Daily Open: Sets the color for the line representing the session opening price.
Frequently Asked Questions

The Library is free. Quant makes it yours.
Pull any concept or indicator into Quant: rebuild it, retune it, or turn it into a backtested strategy of your own.