Concept
Resistance Level
Resistance Level is a Support/Resistance & Levels concept. The Library holds 1 implementation, a working definition you can pull into Quant.
Top Resistance Level indicator
The top custom implementation, built on the original standard Resistance Level formula.
1 total
The Resistance Level implementation below can become a backtested trading strategy — describe your rules and Quant writes the code.
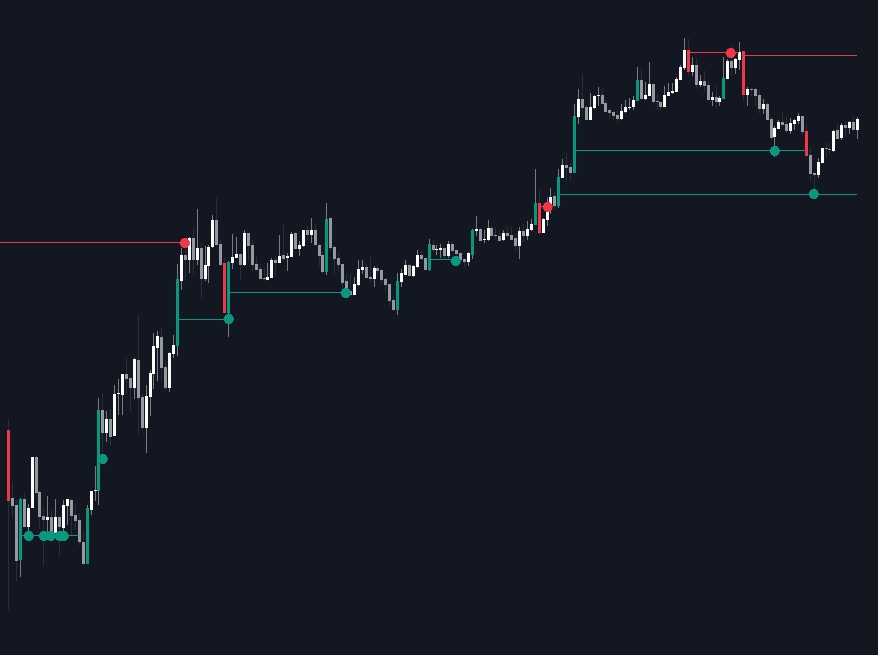
What is a Resistance Level?
A resistance level is a price area above the current market where advances have repeatedly stalled or reversed. It marks a concentration of selling interest: profit-taking by longs, fresh short entries, and resting sell orders parked near a prior high. It is the overhead mirror of a support level, and most resistance begins life as a swing high the market rejected at least once.
In practice resistance is a zone rather than an exact price. Wicks, spreads, and differing data feeds blur any single tick, so experienced chartists mark a band spanning the rejection extremes. The classical mechanics are simple: traders who sold the prior high defend it, traders who bought a failed break above it sell to get out near breakeven, and orders cluster at obvious reference prices. When a level finally breaks and holds, it often switches sides and acts as support on later declines, the pattern known as role reversal.
Resistance matters because nearly every school of technical analysis routes through it. Classical charting builds patterns from it, breakout systems trigger on it, and order-flow frameworks reinterpret the same highs as pools of resting buy stops waiting to be run. Whatever the school, the level supplies the trade's geography: a defined place to act, a spot to set risk beyond, and a reference for judging who is in control. None of that makes it a prediction. Resistance is where a decision tends to happen, not a ceiling that must hold.
How to identify a resistance level
Resistance is read from what price has already done; these steps keep the drawing mechanical instead of wishful.
- 1Mark swing highs with clear rejection: long upper wicks, strong down closes, or several failed probes within a few bars, all signs that sellers absorbed the demand.
- 2Require at least two reactions from roughly the same area, then draw a zone covering the wick extremes and nearby candle bodies rather than a single line.
- 3Weigh confluence: a high that aligns with a round number, a prior period extreme, or a high-volume node is watched by more participants than an isolated print.
- 4Judge the level by its next test: a swift rejection keeps it alive, grinding compression just beneath it often precedes a break, and a decisive close above followed by the level holding from above flips the read.
How traders use it
- As trade location for fades: shorting into a tested zone after rejection confirmation (a bearish close back inside the prior range, a failed probe higher), with invalidation placed beyond the zone rather than inside it.
- As a breakout trigger: a decisive close through the level defines a breakout, and many traders wait for the retest from above before joining, accepting a later entry in exchange for evidence the break is real.
- As a profit target: longs initiated lower routinely scale out or tighten stops into overhead resistance, treating the reaction there as the least predictable part of the trade.
- As a bias frame: repeated acceptance below the level keeps a neutral-to-bearish range read, while acceptance above it argues the market has repriced and the old ceiling should now be auditioned as a floor.
Resistance Level vs related concepts
Support Level: The mirror image: support is a demand area below price where declines stall. Identical mechanics inverted, and a broken level of either kind often converts into the other.
S/R Zone: A zone formalizes the level as a band with depth. Most practical charting already treats resistance this way; the single-price level is the idealized textbook version.
Supply & Demand Zones: Supply zones come from a different school: they mark the base a fast markdown launched from and prioritize the departure leg, while resistance marks where advances stopped and prioritizes the touches.
Dynamic S/R Via MA: Dynamic S/R moves with the market, following a moving average or band, whereas a resistance level is horizontal and anchored to specific historical prices.
Concept family
Support/Resistance & Levels
38 concepts mapped · 38 in the Library
Resistance Level FAQ
Turn Resistance Level into a trading strategy.
Take the implementation from this page into Quant, then build on it, backtest it on real data, and keep refining it in conversation.