KDE Value Clouds
By LuxAlgoFeb 18, 2026

The KDE Value Clouds indicator is an advanced quantitative trading indicator that uses Kernel Density Estimation (KDE) to map the true statistical distribution of price over time. Instead of relying on traditional volume bins or lagging moving averages, this tool reveals high-probability “Value Clouds” — areas where the market has accepted price and spent the most time. These zones often act as powerful support and resistance levels, helping traders build higher-probability trading strategies based on statistical market structure rather than guesswork.
How to Trade the KDE Value Clouds Indicator
This trading indicator identifies areas of price fair value by calculating a continuous probability density function across a user-defined lookback period. Rather than showing simple historical highs and lows, it visualizes where price has statistically clustered — offering a more objective view of equilibrium and imbalance.
Traders can use the KDE Value Clouds to:
- Identify hidden support and resistance zones
- Detect price acceptance vs. rejection
- Anticipate breakout acceleration
- Spot inefficiencies likely to be revisited
Because it is based on statistical density rather than discrete bins, the visualization remains smooth and adaptive across different volatility conditions.
Value Clouds
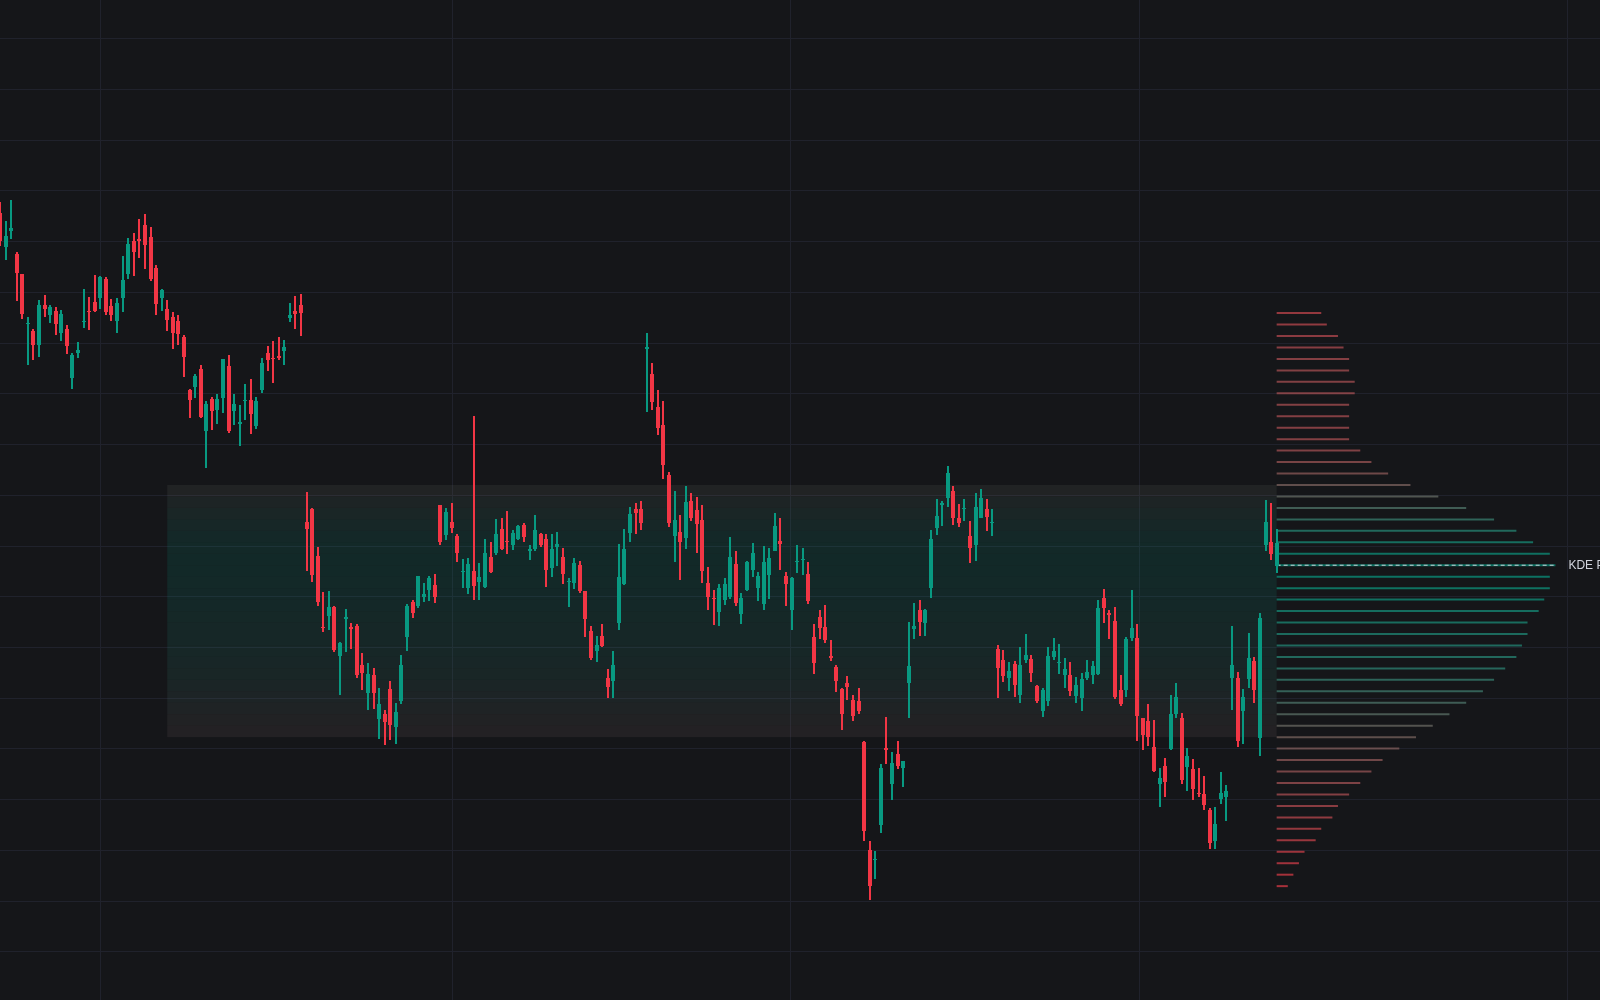
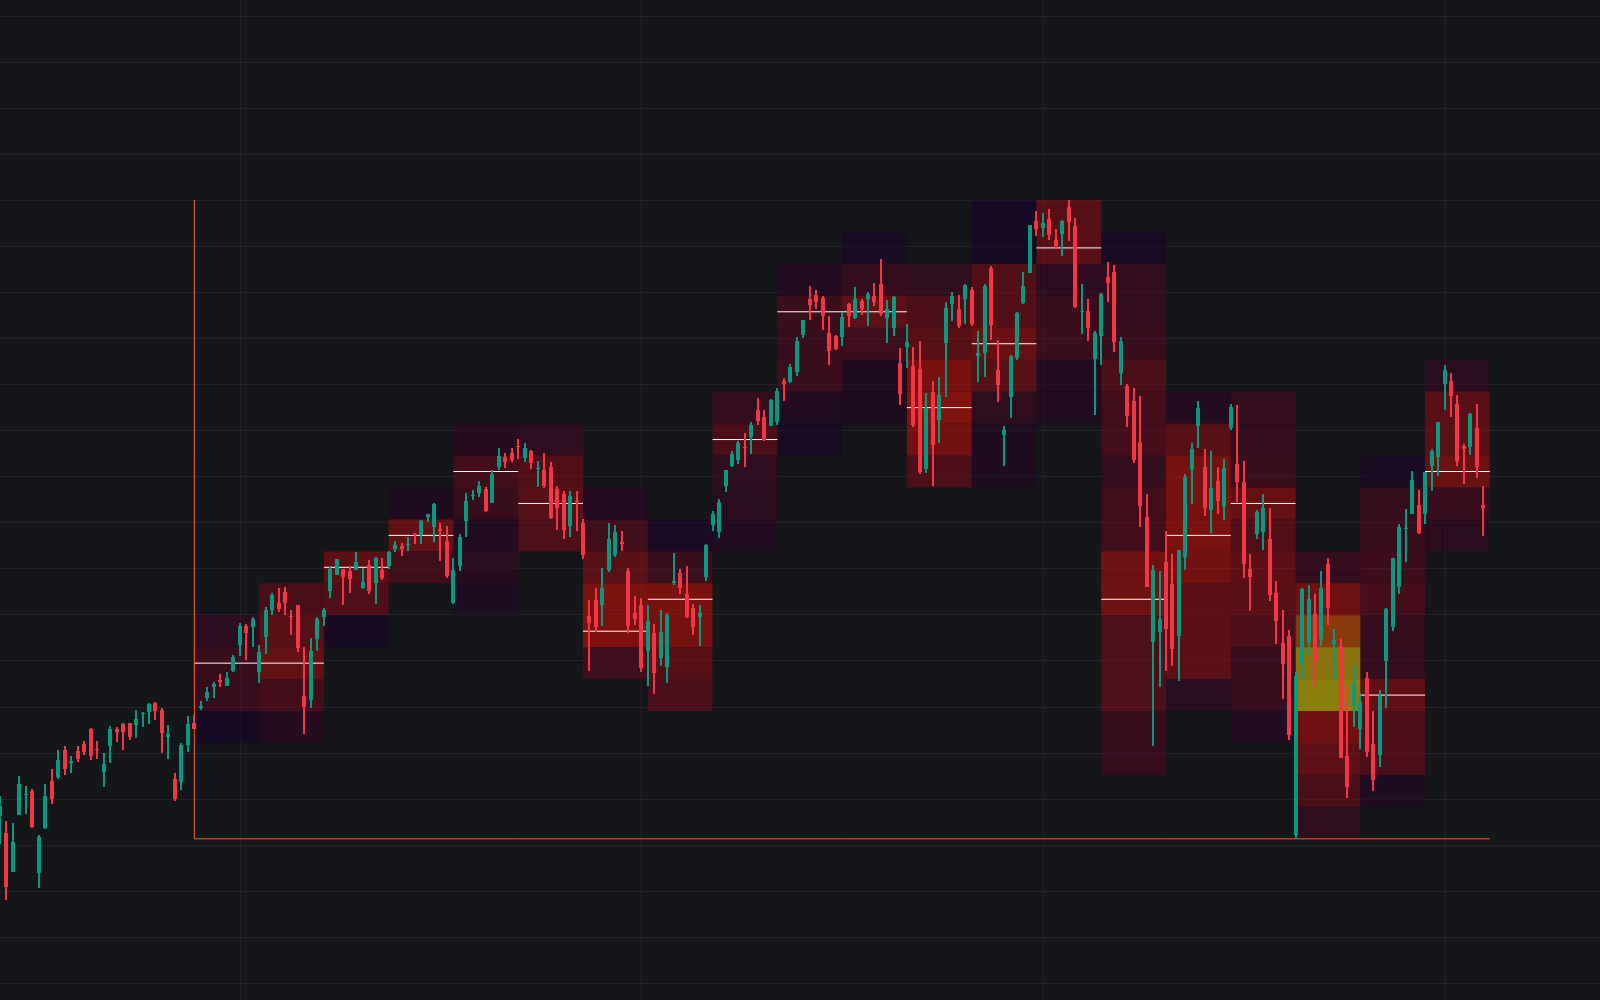
The Value Clouds appear directly on the price chart as gradient overlays. These clouds highlight regions where the probability density exceeds the 50th percentile of the total distribution.
-
High Density (Bright Colors):
Represents a Balance Area where buyers and sellers agreed on value. These zones often act as magnets, pulling price back toward them during retracements. -
Low Density (Gaps):
Represents Inefficient Price Action. These areas form during strong impulsive moves where little trading activity occurred. Markets frequently revisit these zones before establishing new balance.
In practical trading terms:
- Expect consolidation and rotation inside bright Value Clouds.
- Expect fast movement through low-density gaps.
- Watch for rejection at cloud boundaries to confirm trend continuation or reversal.
KDE Profile & Point of Control (POC)
On the right side of the chart, the indicator displays a smooth horizontal KDE profile. This represents the full continuous density curve of price.
The KDE POC (Point of Control) is the single price level with the highest calculated density within the selected lookback period. This level acts as a statistical anchor for the current regime.
How traders use the KDE POC:
- As dynamic support in bullish conditions
- As resistance in bearish conditions
- As a magnet during range-bound markets
- As a sentiment shift level when decisively broken
A sustained breakout above a high-density cloud often signals expanding volatility and a possible new trend phase.
Building a Trading Strategy with KDE Value Clouds
This trading indicator can be integrated into both mean-reversion and trend-following strategies:
Mean Reversion Strategy
- Enter when price moves into a low-density gap.
- Target the nearest high-density cloud or the KDE POC.
- Place invalidation beyond the next cloud boundary.
Breakout Strategy
- Wait for price to build acceptance within a Value Cloud.
- Enter on strong breakout outside the cloud with confirmation.
- Use the previous cloud edge as risk control.
Because the KDE model adapts using statistical principles, it can be applied across forex, crypto, stocks, indices, and futures markets.
Advanced Technical Details
KDE vs. Volume Profile
Traditional Volume Profile tools rely on fixed “bins” to group volume at discrete price steps. This can produce jagged structures and inconsistent results depending on row size.
The KDE Value Clouds indicator uses a continuous probability function instead. Every price observation contributes a small bell-shaped curve to the total distribution. The result is:
- Smoother value representation
- Reduced sensitivity to arbitrary bin settings
- A mathematically robust visualization of true market value
This makes it especially useful for traders who prefer quantitative, statistically grounded trading indicators.
Core Mathematical Concepts
The indicator relies on two key statistical principles:
-
Gaussian Kernel Estimation:
Each price point contributes to the overall density using a Gaussian weighting function. This produces a smooth probability curve that captures the true shape of the distribution. -
Silverman’s Rule of Thumb:
The optimal Bandwidth (smoothing factor) is automatically calculated using Silverman’s formula. This prevents overfitting (too noisy) or oversmoothing (too blurry) and adapts to changing volatility regimes.
Together, these techniques ensure the KDE Value Clouds remain responsive and statistically meaningful across market conditions.
Indicator Settings Explained
Main Settings
-
Lookback Period:
Controls how many bars are used in the density calculation.- Higher values = macro value zones
- Lower values = short-term rotations
-
Bandwidth Multiplier:
Adjusts KDE smoothness.- Higher = broader, smoother clouds
- Lower = more granular, reactive clouds
-
Precision (Steps):
Defines vertical resolution of the density calculation.
Higher values create more detailed profiles but may increase computational load.
Visualization Controls
-
High/Low Density Colors:
Customize the gradient for both the KDE side profile and Value Clouds. -
Profile Width (%):
Controls how far the KDE profile extends horizontally. -
Show Value Cloud on Chart:
Toggle on/off the background density visualization for a cleaner chart if needed.
Why KDE Value Clouds Improve Market Structure Analysis
Unlike lagging indicators such as moving averages, this trading indicator focuses on where price has statistically agreed, not just where it has been trending.
It answers critical trading questions:
- Where is fair value?
- Where is imbalance?
- Where is the market likely to rotate?
- Where could volatility expand next?
By visualizing the full probability distribution of price, the KDE Value Clouds indicator provides a powerful edge for traders seeking objective, data-driven market structure insights.
FAQ
What makes KDE Value Clouds different from Volume Profile?
Volume Profile uses fixed bins that can distort value depending on row size. KDE uses a continuous probability density function, producing smoother and more statistically accurate value zones.
Can this indicator be used for scalping and swing trading?
Yes. Use shorter lookbacks for intraday scalping strategies and longer lookbacks for swing trading or position trading.
Does the KDE POC repaint?
The KDE POC updates dynamically as new data enters the lookback window. It reflects the most recent distribution of price, ensuring relevance to current conditions.
How do I access the KDE Value Clouds indicator?
You can get access on the LuxAlgo Library for charting platforms like TradingView, MetaTrader (MT4/MT5), and NinjaTrader for free.
Free indicator
Get free access to this indicator on the platforms below.
Unlock the entire LuxAlgo Library
Every indicator, every strategy, full charts, and complete access to Quant — our AI agent.