Introducing Vela by LuxAlgo: The Next-Generation Charting Platform
Today we are launching Vela, our charting platform, and the biggest upgrade in our history.
For six years we built on top of other platforms. Millions of traders ran our tools on charts we did not control, and our biggest user requests became impossible to fulfill given that we didn't control the whole workspace for our products. That era is now over. Vela is live at vela.luxalgo.com: state-of-the-art charts engineered in-house from the rendering engine up, running everything we have ever built in one space we fully control, free to start.
Here is everything that launched today:
1.) State-of-the-Art Charts
Sub-millisecond rendering at any data density, and zoom that feels like touch. The engine renders dense history without dropping a frame: zoom anchors to your cursor, detail adapts as you dive, and date-range presets snap you across years in a click. Charting should move at the speed you think, and that is exactly why we built the engine ourselves.
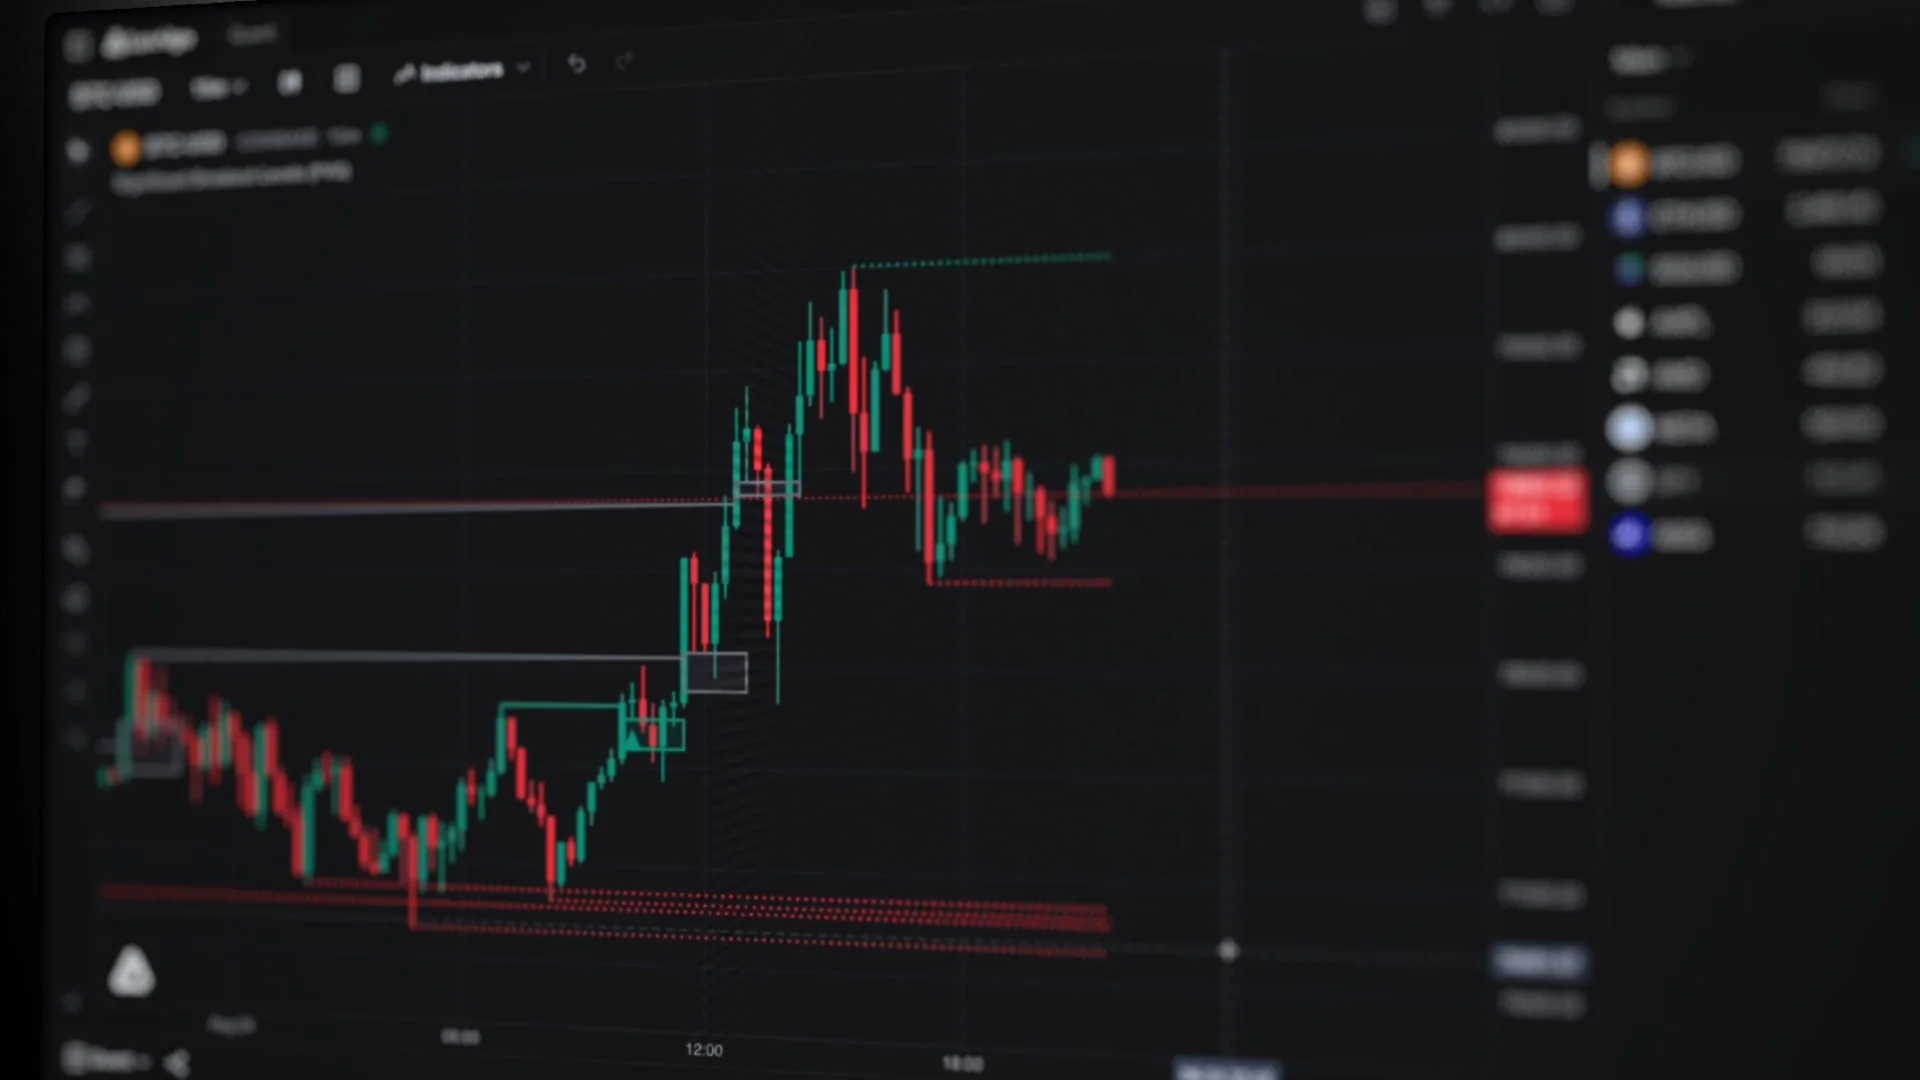
These are the easiest charts you will ever switch to: faster, smoother, with a full orderflow suite built in, and everything traders expect from a platform exactly where it should be.
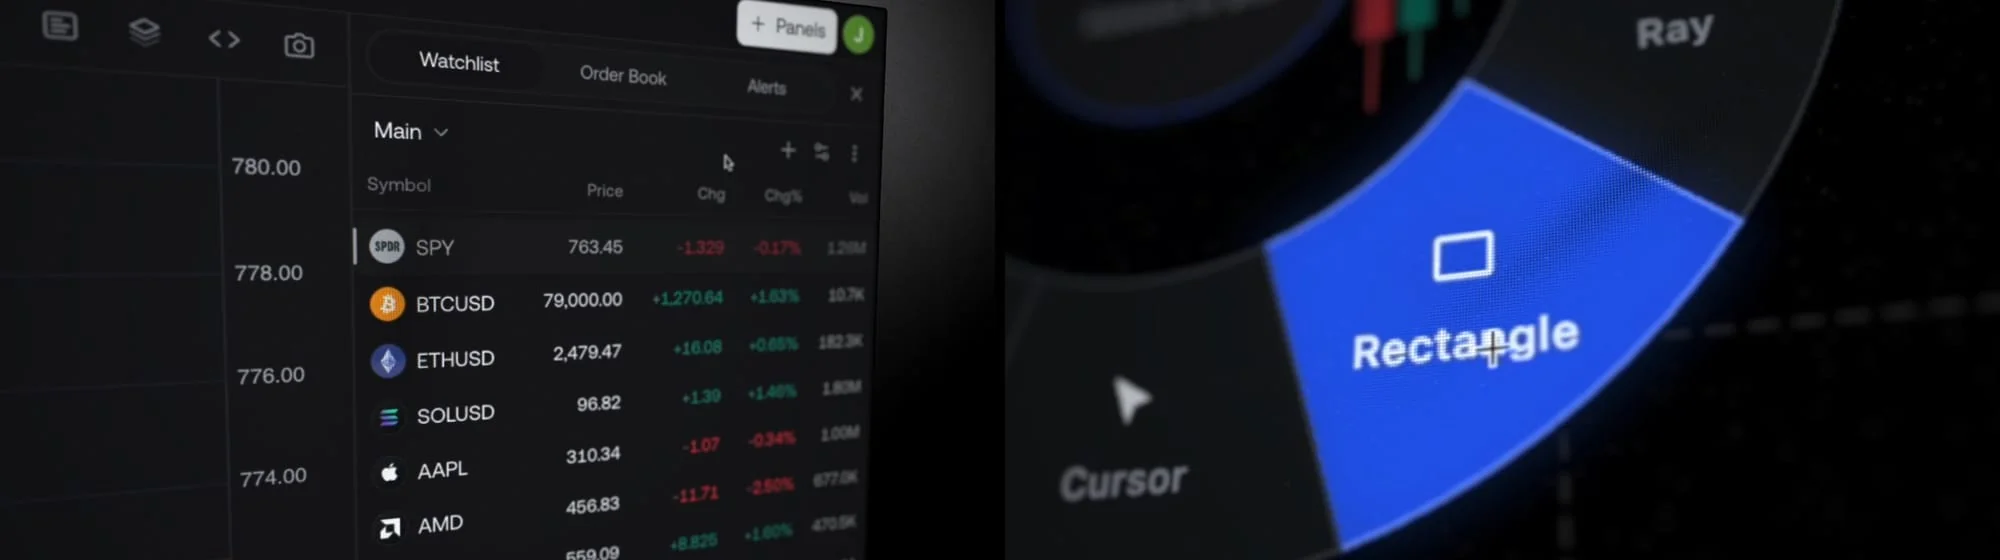
Quant, our coding agent, sits on the side of your chart at all times, available to interpret, build, and backtest any indicator or strategy for you, and its capabilities are expanding massively from here.
All of it is free for everyone, with the most generous limits on the web. See the full charting rundown here.
2.) Multi-Chart Layouts That Stay in Sync
Split the workspace side by side, stacked, or into a grid, up to sixteen charts at once, and drag the splitters until it is exactly your desk. One chart is always the active cell: symbol changes, intervals, drawings, indicators, and Quant scripts land there, so you always know where an action will be applied. Turn on sync and the symbol, interval, crosshair, and style follow across every cell; turn it off wherever you want independence, and mirror drawings across all charts when you do.
3.) The Entire LuxAlgo Library, Built In
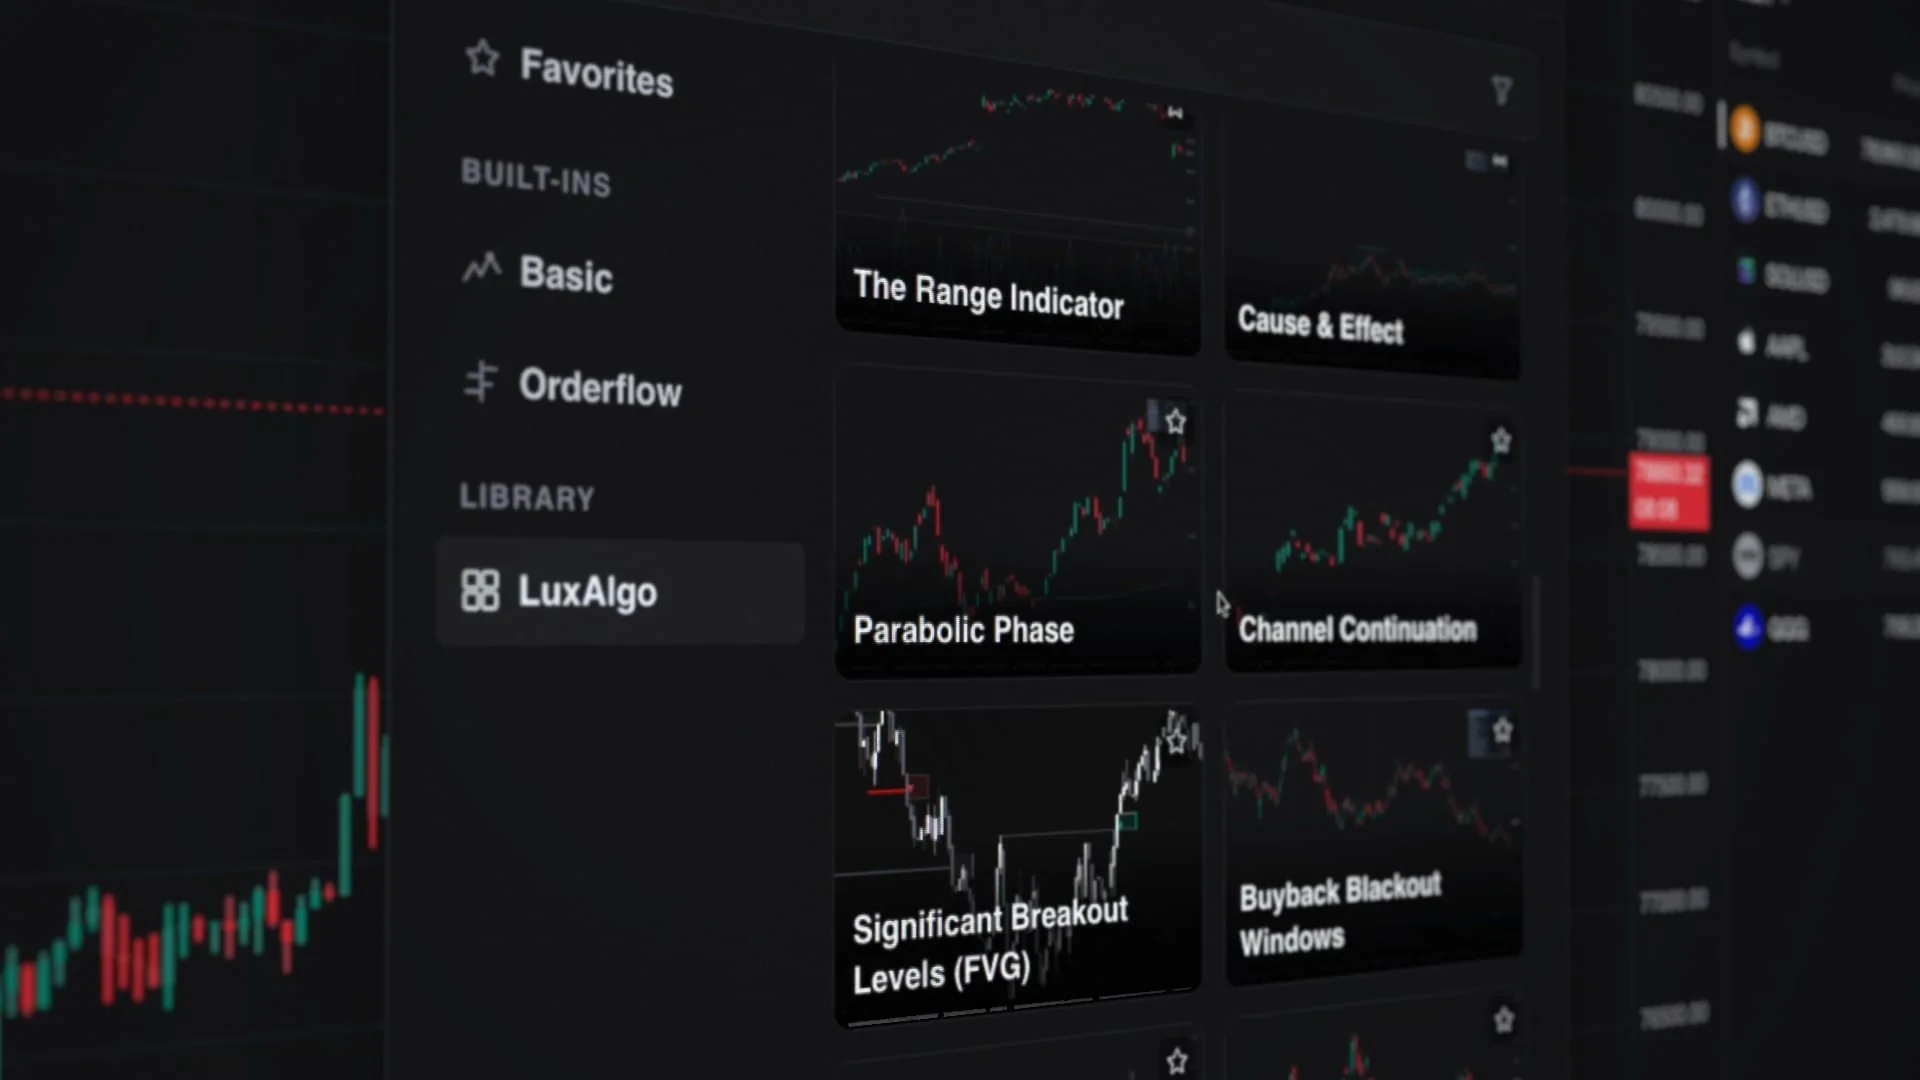
800+ indicators from the LuxAlgo Library ship inside the platform, sitting right next to the built-ins. Five years of published tools, one click from any chart. And because Quant lives on the same canvas, every one of them is one prompt away from becoming a backtested strategy, or an indicator/strategy of your own.
4.) Real Orderflow, on Every Plan
Orderflow has always been the expensive add-on: a dedicated platform, a separate data feed, another login. On Vela it is simply native, built from real executed trades, never inference dressed up as depth.
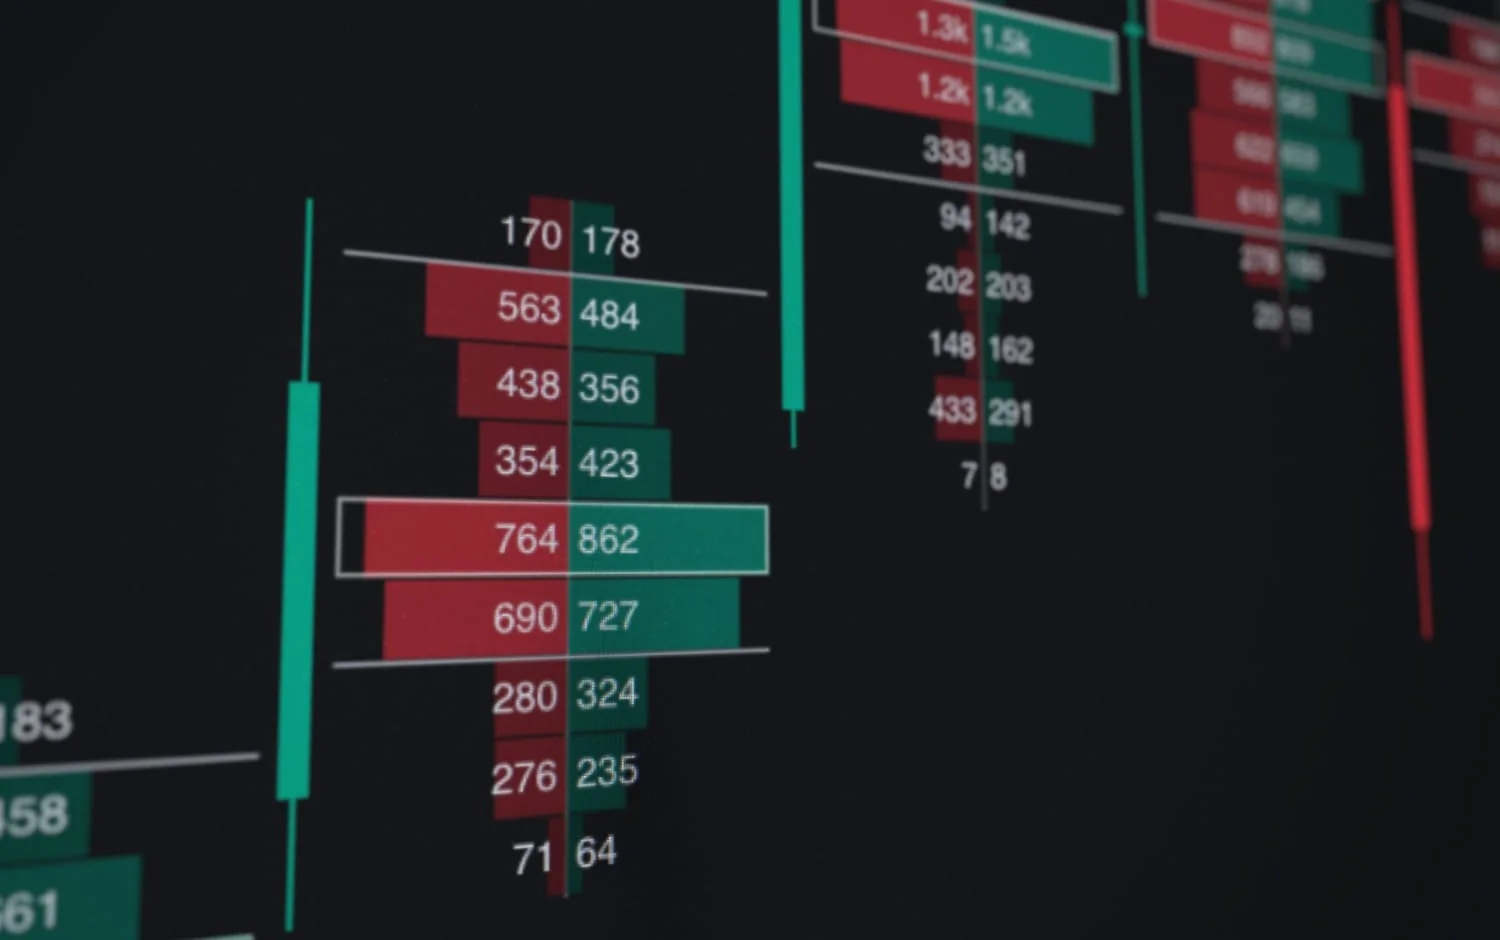
Footprint and TPO are full chart types: switch the style and the profile is the chart. The footprint runs up to five independent profiles per bar (bid×ask, ladder, volume, or delta) with diagonal imbalance highlighting, stacked-imbalance zones, unfinished-auction detection, and naked points of control projected until price returns to them. TPO adds session profiles with value areas, initial balance, single prints, and multi-day composites. The rest of the suite lives one picker away: volume delta and CVD, session and rolling profiles, volume tails, trade counts, bar stats, volume bubbles, and anchored VWAP with deviation bands.
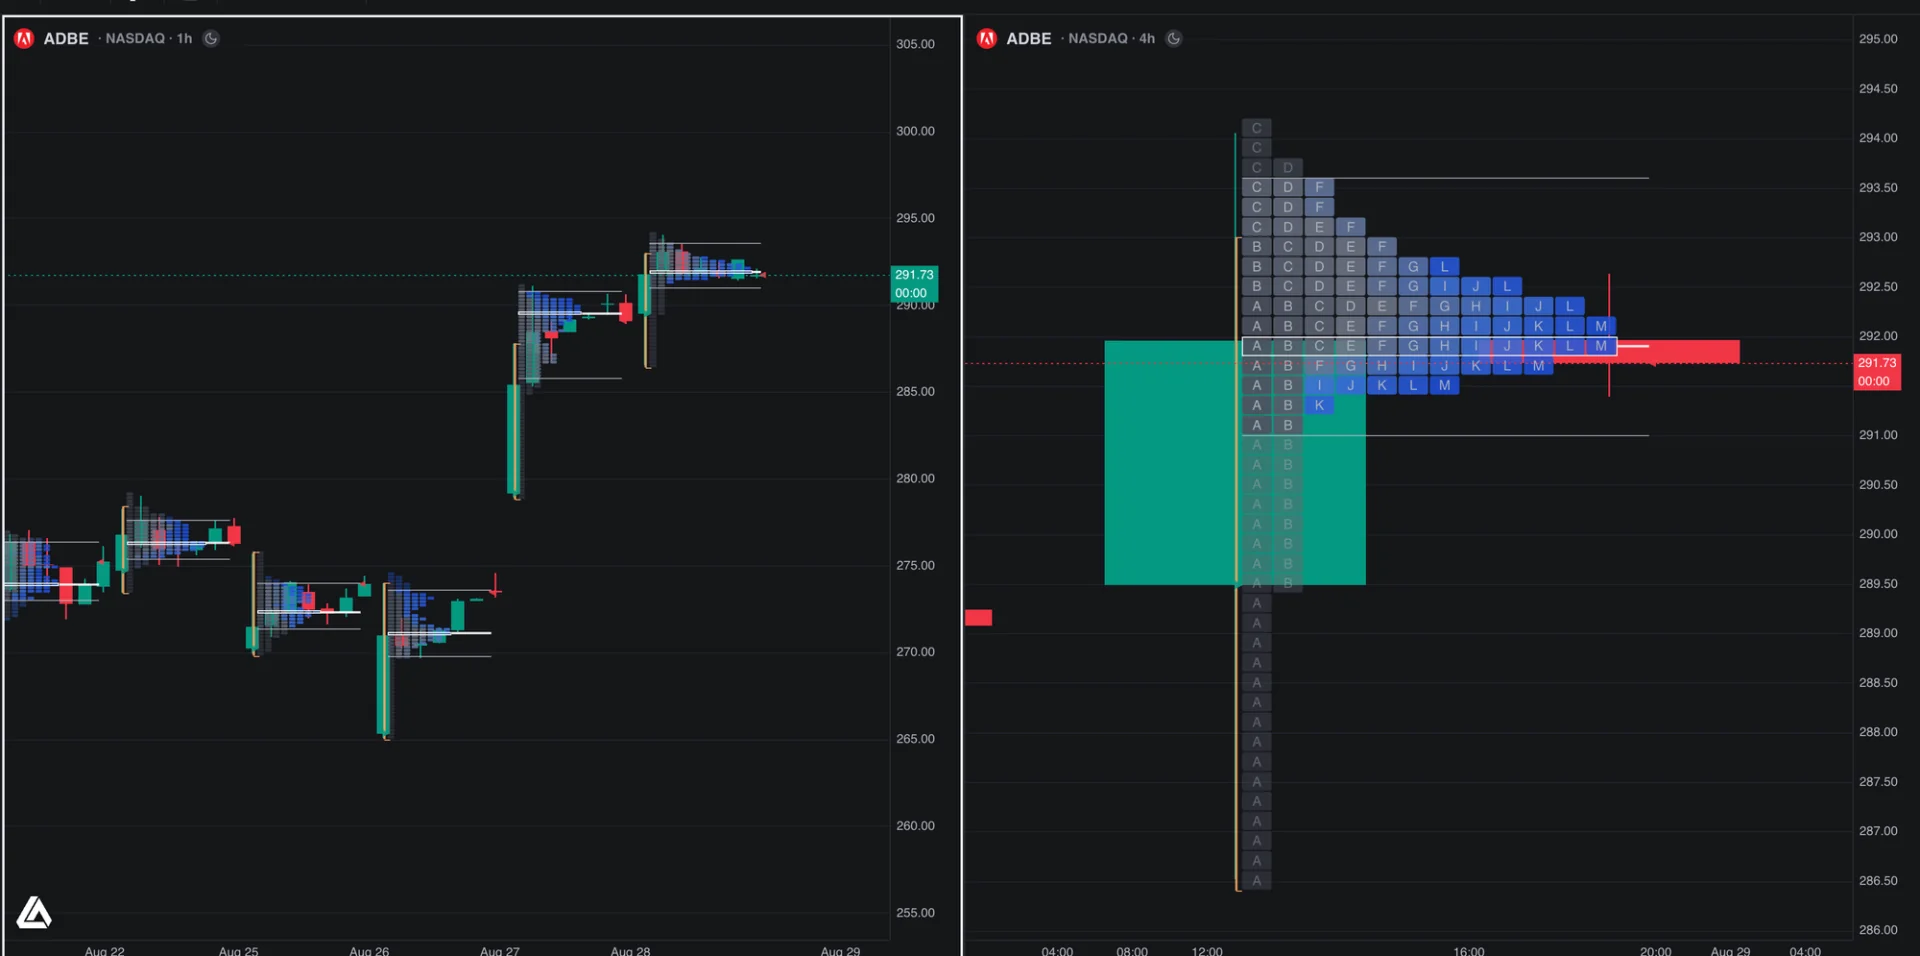
The full suite runs on every plan, including Free. The only thing that scales with your plan is how far back the history reaches. The whole arsenal is here.
5.) CME Futures Data, Included
Futures run on licensed, real-time CME Group data with 16 years of history, included in every paid plan at no extra cost. No exchange add-ons, no per-feed pricing, no surprise line items at checkout. The tape most platforms sell as an upsell is simply in the box.
6.) AI-First From Day One
Quant, our coding agent, powers every layer of the platform. Describe an indicator and it builds it. Hand it anything from the Library and it turns it into a strategy. It auto-debugs Pine Script®, backtests across up to 50,000 bars of history, and the built-in trade journal tracks your results with analytics and AI reflection on what is actually working. Quant code repair is included with Premium and above.
This is what a charting platform looks like when it is built for the agentic era from day one. And we are launching new features every week.
Vela’s Core Is Open Source
One more thing. Vela’s core is open source, at velacharts.dev: the same engineering that powers the platform, free for anyone building charts on the open web. We believe the foundations of trading technology should be open, the same belief behind PineTS and the Library, and we intend to keep building them that way.
Live Now
Vela is live on every account right now. Open a chart, pull the Library onto it, and see what six years of building was for.
Or compare plans at luxalgo.com/pricing. The free tier is the most generous on the web, and the full orderflow suite is on it.
Read next