Directional Bias Using Volatility Skew Patterns
Volatility skew shows how options markets price upside and downside risk differently. It can inform a directional hypothesis, but expensive downside protection does not establish that the underlying asset will fall. The useful question is whether a comparable skew measure is changing, why it might be changing, and whether price action supports the same view.
Start with options data for the skew measurement. Then use native LuxAlgo charts to examine the underlying market and develop explicit price-based rules with Quant, our coding agent. Chart volatility, trend signals and options implied volatility are different inputs; one should not be substituted for another.
Read the shape before assigning a direction
Implied volatility (IV) is inferred from an option price using a pricing model and inputs such as strike, time to expiration, underlying price and interest rates. Historical volatility measures past underlying returns. Strike skew compares IV across strikes for the same expiration; term structure compares expirations. See the Options Industry Council’s volatility explanation and our guide to historical versus implied volatility skew.
| Shape, with strike increasing left to right | What it describes | What it does not establish |
|---|---|---|
| Downward or reverse skew | Lower-strike options have higher IV; out-of-the-money puts may be relatively expensive. | An imminent decline. Persistent demand for protection can coexist with a rising equity market. |
| Upward or forward skew | Higher-strike options have higher IV; out-of-the-money calls may be relatively expensive. | A guaranteed rally. Upside hedging needs, supply risks and positioning can affect pricing. |
| Smile | Both wings have higher IV than options near the money. | Direction by itself. Examine each wing and the overall IV level. |
These are descriptions of a curve, not universal trading signals or fixed properties of an asset class. Equities often show downside skew, while some commodity markets exhibit expensive upside risk; the actual contract and observation date matter. A smile can also be asymmetric. Our smile versus skew guide develops that distinction.
Calculate a comparable risk reversal
One common measure is the 25-delta risk reversal = 25-delta call IV − 25-delta put IV, using options with the same expiry and equal absolute delta. CME’s CVOL skew lesson explains this two-point comparison and why broader surface measures can give different results. A 25-delta option here means an absolute model delta near 0.25; it is not an option 25% away from the underlying price.
For a hypothetical observation, call IV of 24% minus put IV of 30% gives −6 volatility points. If the next comparable observation is 27% minus 31%, the result is −4 points: the difference has risen by 2 points, but puts still have higher IV. Both wings became more expensive in IV terms. Calling this simply “bullish skew” would conceal those facts.
A provider using put IV minus call IV would report +6 for the first observation. Before interpreting positive or negative values, check the formula, units, delta convention, maturity and whether the series is normalized. Risk reversal expressed in IV points is also different from the premium and payoff of an actual two-leg risk-reversal trade.
Keep the comparison consistent
- Use the same underlying, timestamp, expiry or documented constant maturity, and delta or moneyness convention. Comparing a nearly expired contract with a fresh monthly contract can create a false shift.
- Record bid and ask quotes, the IV calculation convention and missing or stale observations. A wide spread or a tiny wing premium can make inferred IV unstable. A midpoint is not a promised execution price.
- Track at-the-money IV alongside skew. A flatter curve can result from calls rising, puts falling, or both moving at different rates.
- Check events, dividends, settlement and exercise style. A single constant-volatility Black–Scholes assumption does not reproduce the full observed smile; model differences also affect comparisons.
Match the horizon to the question
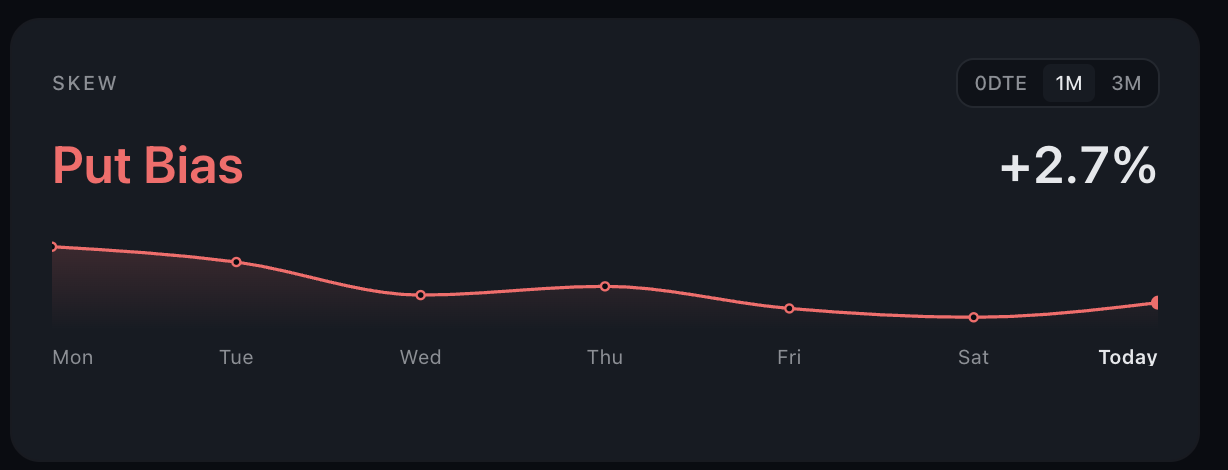
Same-day, one-month and three-month skew answer different questions. Select a horizon that covers the event or exposure you are studying; do not assign every day trader to 0DTE or every institution to three months.
| Horizon | Useful question | Comparison risk |
|---|---|---|
| 0DTE or first available expiry | How is near-expiry risk being priced around today’s session or event? | 0DTE means expiration today. A first-expiration series may instead include a later weekly expiry. Rapid changes and thin quotes can distort readings. |
| Approximately one month | How does pricing around a planned multiweek exposure differ from recent comparable observations? | Listed expiry dates roll. Check whether the series uses a fixed contract or interpolation to constant maturity. |
| Approximately three months | How is risk priced across a quarter or several events? | A quarterly horizon is not automatically a long-term forecast; liquidity and event composition may differ. |
A constant-maturity series holds the target tenor steady through interpolation; inspect the methodology and avoid comparing it directly with an unadjusted expiring contract. An ATM-normalized measure expresses relative shape using its stated formula. Neither transformation removes model risk or turns a price of protection into a reliable directional prediction.
Choose tools for their actual inputs
The following tools serve different parts of the workflow. This is a capability comparison, not a measured performance ranking. Check market coverage, data delay and current access before relying on a feature.
- LuxAlgo native charts support underlying-price analysis. Quant can help write supported indicators and strategies for those charts. An underlying-price backtest is not an options-chain or multi-leg options backtest.
- Market Chameleon Volatility Comparisons compares 30-day IV with historical benchmarks and peer groups. That page measures volatility levels, not a strike-skew curve; use an appropriate options-chain or smile view for wing comparisons. Its site labels market data as delayed 15 minutes.
- MenthorQ Skew describes first-expiration/0DTE, one-month and three-month views. Confirm the series definition and distinguish provider labels from the risk-reversal convention above.
- Amberdata’s analytics platform offers digital-asset and derivatives datasets; its public dashboard includes Deribit BTC ATM constant maturities. ATM term data alone does not measure strike skew. Confirm the exact market, surface coverage and available history for the analysis you need.
For chart context, the LuxAlgo Library’s trend and market-structure tools on a Quant Chart can organize a price hypothesis from trend strength, price compression, volume sentiment, structure and order blocks. They do not supply an options-IV surface or reveal every trader’s positioning. Optimizing a sensitivity setting on recent bars is not evidence that it will generalize.
Turn a directional hypothesis into testable rules
Suppose a trader observes a less negative one-month risk reversal and wants to investigate an upside price breakout. Keep the options observation and the price trigger separate. A practical research process is:
- Record the options observation. Save the timestamp, expiry, provider, formula, wing IVs and event context. Define what counts as a change before examining subsequent returns.
- Specify the price rule. For example, a completed daily close above the highest high of the preceding 20 completed daily bars. Exclude the current bar from that threshold, use one position at a time and state when the order becomes eligible.
- Build the supported strategy. In native LuxAlgo, ask Quant to write the underlying-price strategy. Inspect the generated code, verify entries and exits, then run it manually. If the required historical skew series is unavailable, test the price rule alone and label it that way; do not invent a skew input or use today’s reading for past trades.
- Set realistic assumptions. Review strategy Inputs and Properties, including capital, order size, commissions, slippage and margin where relevant. Specify stop, target, time exit, simultaneous-exit handling and gaps. Compare with a baseline over unseen dates and different market conditions.
- Evaluate any skew filter separately. A valid combined test needs point-in-time options data aligned to when it was actually available, including missing observations and expiry rolls. Compare the same price rules with and without the filter. Report sample size, drawdown and costs, not only a favorable win rate.
For an illustrative underlying-share trade, planned entry 100 and stop 96 imply $4 of price risk per share. With a $200 risk budget and $20 reserved for estimated costs, floor(($200 − $20) / $4) gives 45 shares, or $4,500 notional. A target of 108 gives $360 gross reward against $180 planned price risk, or 2R before costs. An exit after a gap at 90 would lose $450 before costs. Skew does not make the stop an assured fill.
Options require their own position model: contract multiplier, premium, delta, gamma, vega, time decay, exercise and assignment can all matter. A correct view of the underlying can still lose money in an option as IV falls or time passes. Avoid treating expensive puts as an automatic instruction to sell unhedged downside risk.
Video: an introduction to options skew
This Masters in Trading lesson introduces skew using an options example. Use it for conceptual background, alongside the explicit IV formula and data checks above; examples are not current trade recommendations.
Frequently asked questions
Does negative skew mean the market will fall?
No. Under call IV minus put IV, a negative risk reversal means the matched put has higher IV. Hedging demand and risk compensation can keep it negative even while the underlying rises.
Why do two providers show opposite signs?
They may subtract the wings in opposite orders or use different normalization, deltas or maturities. Compare formulas and units before interpreting positive or negative values.
Is chart volatility the same as options skew?
No. Chart volatility describes underlying-price behavior. Options skew compares implied volatilities across strikes for a common expiration and requires appropriate options data.
Should every day trader use 0DTE skew?
No. The relevant expiry depends on the exposure and event being studied. Same-day options can change rapidly, and a first-expiration series is not necessarily 0DTE.
Can I backtest an options-skew filter in LuxAlgo automatically?
Do not assume the required options history is available. Quant can help write supported native strategies; inspect the code and run manually. A price-only test cannot validate an unavailable historical skew filter or multi-leg options payoff.
What should I check before acting on a skew change?
Check the formula, timestamp, matched maturity and delta, bid-ask quality, ATM IV and event calendar. Define an independent price trigger, position size and exit rules, then evaluate costs and out-of-sample behavior.
References
- CME Group — Introduction to CVOL Skew; risk-reversal definitions and broader surface measures.
- Options Industry Council — Volatility & the Greeks; IV, historical volatility and option sensitivities.
- MenthorQ — Skew model; provider horizon definitions and credited illustration.
- Market Chameleon — Volatility Comparisons; IV-level comparison methodology.
- Amberdata — Analytics platform; dataset scope and ATM constant-maturity example.
- LuxAlgo — Native charts introduction; charting workflow.
- LuxAlgo — Quant strategies and native chart strategies; strategy creation, execution and settings.
Read next