Dynamic vs Static Support: When to Use Each
Static support stays at a chosen price while it remains active; dynamic support changes according to a defined calculation. The distinction is how the reference is constructed, not whether you trade intraday or hold positions for months. Either can be used on different chart intervals, and neither guarantees that price will reverse.
Use static levels to track a specific historical price or zone. Use dynamic references when your rules depend on an evolving average, band or other calculation. Combining them can organize a trade hypothesis, but an overlap alone does not establish a stronger signal or justify a larger position.
Static and Dynamic Support Compared
| Feature | Static reference | Dynamic reference |
|---|---|---|
| Construction | A fixed price or zone from selected historical information | A value or zone recalculated from specified inputs |
| Examples | Prior session low, confirmed swing zone, fixed-anchor retracement | Moving average, volatility band, Ichimoku component |
| What changes | The level may expire or be replaced under a rule | The calculation can update each bar or when new information is confirmed |
| Useful question | How does price behave around this selected location? | How does price behave relative to this evolving measure? |
| Main limitation | A previously relevant price can fail or become outdated | The measure can lag, fluctuate or be misaligned in a historical test |
Support is a location where buying may oppose a decline; resistance is where selling may oppose an advance. Treat both as references to investigate, not physical barriers. A zone can be more practical than an exact price, but its width and failure condition should be defined before the outcome is known.
Static Support: Keep the Reference Consistent
Common static references include a previous session’s high or low, a confirmed swing point, a round number or a zone containing repeated reactions. A Fibonacci retracement is also fixed while its selected anchors remain fixed. Replacing the anchors changes the analysis; it should not silently rewrite an earlier decision.

Define the Level and When It Becomes Available
- Choose the reference consistently: for example, the prior completed session’s low or a swing confirmed by a specified number of later candles.
- Set the zone boundaries or tolerance using a stated rule. Do not widen a zone after a breach merely to preserve a successful-looking example.
- Record the instrument, venue, chart interval, session and adjustment conventions. Different feeds or trading hours can produce different extremes.
- Specify when the reference expires, breaks or is replaced. A fixed price need not remain relevant forever.
A confirmed swing may be drawn at an earlier candle even though later candles were needed to recognize it. In a historical strategy, the level cannot be used before that confirmation. Likewise, the final low of today’s session is not known while that session is still trading.
Where Static Levels Help—and Where They Can Fail
A stable reference makes it easier to compare tests, breaks and retests. Range boundaries are one useful application, but prior highs and lows can also matter during trends or intraday trading. Static does not mean slow, long-term or automatically more reliable.
Repeated reactions can make a location worth studying, but additional touches do not guarantee that it becomes stronger. News, gaps and changing participation can carry price through it. A former support zone may later be studied as resistance after a break; that role reversal remains a hypothesis requiring a defined test.
Dynamic Support: Know the Calculation
A moving average or band recalculates from price data, so its location can change even without a new manually selected anchor. Some indicators instead produce horizontal segments that update only after a new pivot is confirmed. Judge the update rule rather than the word “dynamic” in a product name.

Moving Averages and Volatility Bands
An EMA can provide an evolving trend reference. A 20-period EMA is a recursive calculation whose older observations retain diminishing weight; it is not simply an average of only the most recent 20 closes. Specify the source price and interval. Twenty bars means days only on an appropriate daily chart.
Bollinger Bands commonly place standard-deviation-based boundaries around an average. Price can travel along or beyond a band during a trend, so the lower band is not automatically a buy level and the upper band is not automatically a sell level. Band width describes dispersion under the chosen formula, not certainty about direction.
A more responsive setting can react sooner and also change more often during choppy movement. A smoother setting can reduce some fluctuations while responding later to a sustained change. Volatility alone does not determine which tradeoff is appropriate.
Ichimoku: Forward Plotting Is Not Future Knowledge
The StockCharts Ichimoku reference explains the standard components. The conversion and base values use the midpoints of the 9- and 26-period high–low ranges. Leading Span A averages those two values; Leading Span B uses the midpoint of the 52-period high–low range. Under standard settings, the spans are displayed 26 periods ahead.
That display offset uses information already available when the values were calculated. It does not reveal future prices or guarantee future support. In a test, distinguish the cloud displayed at the current candle from newly calculated spans plotted ahead. The lagging close plotted backward must not introduce later information into earlier trade decisions either.

Choose by the Decision You Need to Make
| Situation | Possible reference | Rule to define first |
|---|---|---|
| A test of a prior range boundary | A fixed horizontal zone | What counts as a touch, rejection or break |
| A pullback during a defined trend | A selected moving average or band | Trend condition, entry trigger and failure point |
| A break and subsequent retest | The original boundary retained for comparison | Break confirmation, retest window and setup expiry |
| A static zone overlaps an evolving measure | A combined condition | Allowed separation, candle timing and whether the extra filter helps |
| Rapid, irregular movement | Either method—or no trade under the plan | Costs, available execution and conditions that invalidate the setup |
A weekly moving average can be a dynamic reference for a long-horizon strategy, while yesterday’s low can be a static reference for an intraday strategy. There is no universal requirement to use static support for weeks or months and dynamic support for short-term trades.
Define “trending” or “range-bound” with information available at the decision time. Classifying a period only after seeing its full price path can make either method appear more effective than a live rule would be. Compare the same entry and exit assumptions when evaluating alternatives.
Combine the Methods Without Overstating Confluence
Suppose a fixed zone runs from 99.5 to 100.5 and a completed-bar EMA is 100.2. The references overlap, but both may reflect the same recent price activity. The overlap is a condition you can test, not independent confirmation that the zone must hold.
A hypothetical rule might require an existing upward trend, a visit to the zone and a completed close back above 100.5 before considering entry. Specify how the EMA condition is evaluated, how long the setup remains valid and what happens if the trend condition fails. A touch, a close and an intrabar crossing are different triggers.
If an illustrative entry fills at 101 and the planned adverse exit is 98, the distance is three price units. For an instrument worth $1 per price unit per position unit, a $300 planned allowance implies 100 units before costs. That calculation follows the allowance and distance, not the number of indicators that agree.
Respect Timing and Execution
An unfinished candle can change a moving average or band. Use completed values when the rule requires confirmation, and align any higher-timeframe input correctly. Do not copy the eventual close of an unfinished hour backward into decisions made earlier in that hour.
A chart level is not an order fill. A limit order may remain unfilled, and a market or stop order can execute worse than expected. Include spread, fees, slippage, gaps and size constraints. A planned adverse distance is an estimate, not a guaranteed maximum loss.
If you trail an exit behind a dynamic reference, define whether it can move only in the favorable direction. For a long position, a ratcheting rule would not lower the stop merely because the average falls; for a short position, it would not raise the stop as the reference rises. Other exit rules are possible, but they must be explicit. Trailing does not guarantee that open profit is preserved.
Practice and Test the Complete Rules
- Study each method separately before adding an overlap filter. Save the same baseline so the comparison is meaningful.
- Specify level construction, confirmation time, entry order, adverse exit, target or other exit, position size and setup expiry.
- Use realistic costs and keep later evaluation data separate from the data used to select settings.
- Review individual failures, net results, drawdown, trade count and exposure. A higher win rate alone does not prove an improvement.
- Use suitable simulation to practice execution and record deviations from the plan; simulated fills do not guarantee identical live fills.
Avoid continually changing anchors, tolerances and indicator periods until past trades look convincing. A useful review distinguishes a code or timing error from a deliberate new strategy variation. Keep the original version and compare the revision separately.
Research Support Rules in LuxAlgo’s Native Platform
Use native charts and workspaces to organize the fixed reference and evolving calculation. Check data coverage, instrument, interval and session settings in each view. More views do not automatically provide more independent evidence.
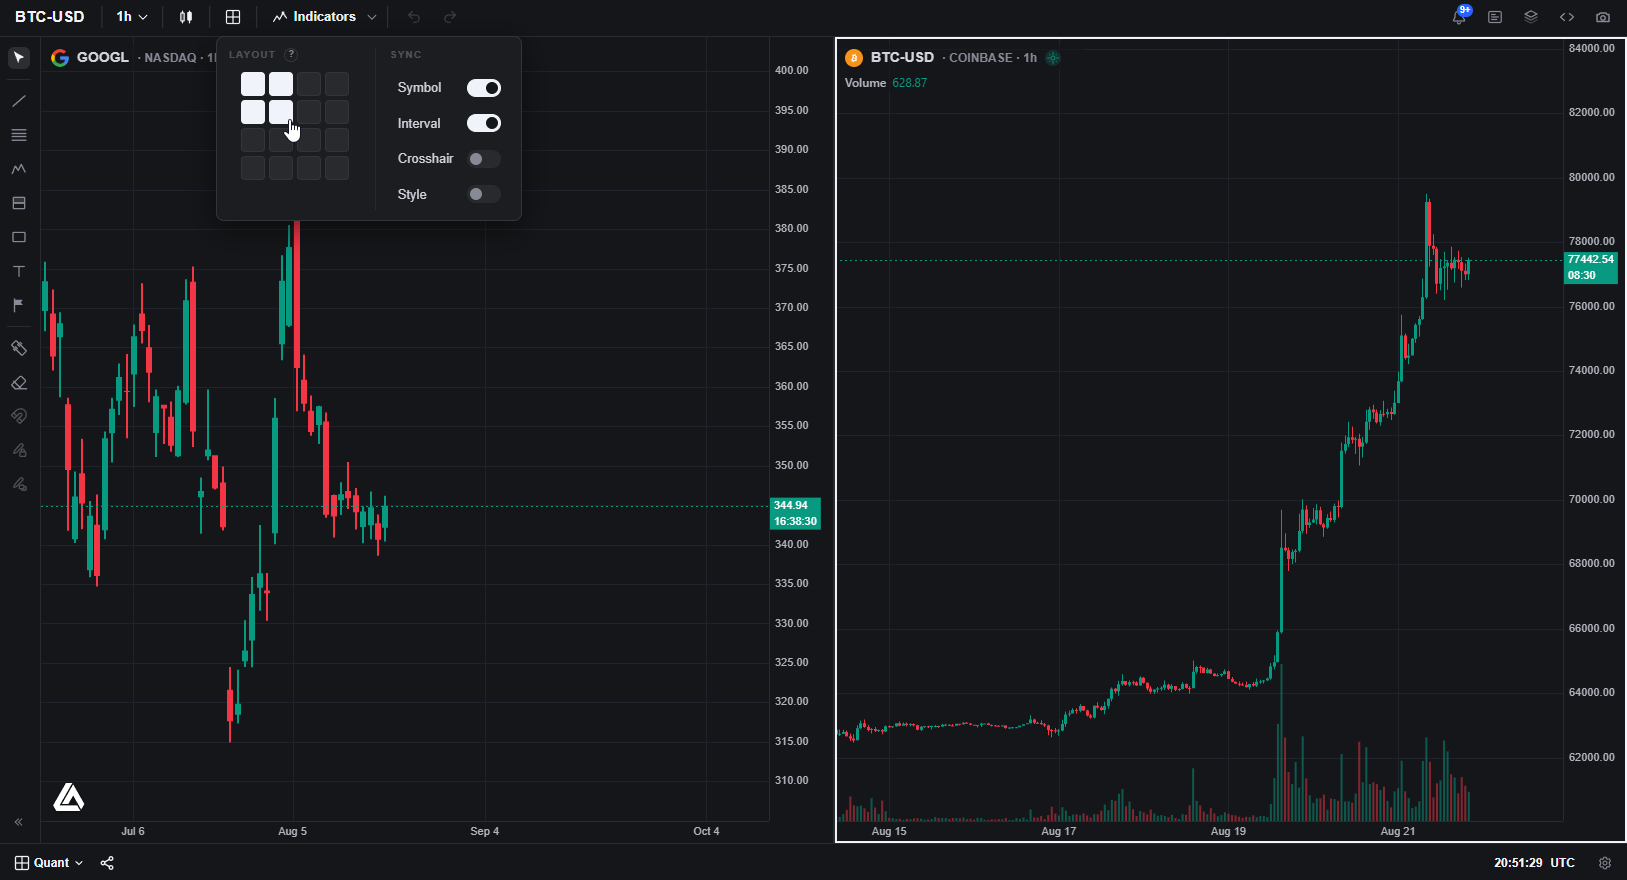
Ask Quant, our coding agent to express a supported version of your complete rules. Inspect the generated code and run it manually. Check pivot confirmation, zone persistence, candle timing and any displaced indicator values. A drawing visible in historical data must not become available to the strategy before it was knowable.
Review strategy settings and individual trades with realistic costs and later evaluation data. Verify that the implementation actually supports every required input rather than assuming a chart overlay supplies an executable strategy.
The TradingView toolkits and legacy Backtesting Assistant are separate workflows. Price Action Concepts and Signals & Overlays should not be reduced to “static” and “dynamic” labels: check the specific feature’s calculation and update behavior. An indicator display, an alert and an executed order are different things.
Frequently Asked Questions
What is the difference between static and dynamic support?
A static reference remains at a selected price while active. A dynamic reference updates according to its calculation. The distinction concerns construction, not trading horizon.
Is static support only useful for long-term trading?
No. A prior session low can be an intraday static reference, while a weekly moving average can be a long-horizon dynamic reference.
Does overlapping support make a trade more reliable?
Not automatically. The references can share the same price information. Test a defined overlap condition against the individual methods under consistent costs and trade rules.
Does the Ichimoku cloud predict future support?
Its forward display uses values calculated from already available data. The offset does not reveal future prices or guarantee that a boundary will hold.
Can a dynamic stop guarantee a profit?
No. A trailing rule can surrender open profit or fill worse than planned. Define how it updates and account for gaps, costs and execution constraints.
Read next