Concept
Ichimoku System
Ichimoku System, also known as Tenkan-sen, Kijun-sen, Senkou Span A/B, Kumo/cloud, is a Trend concept. The Library holds 2 implementations, each one a working definition you can pull into Quant.
Top Ichimoku System indicators
The top custom implementations, built on the original standard Ichimoku System formula.
2 total
Every Ichimoku System implementation here is strategy-ready: open one in Quant, set your rules, and it backtests automatically.
.png&w=3840&q=75)
What is the Ichimoku System?
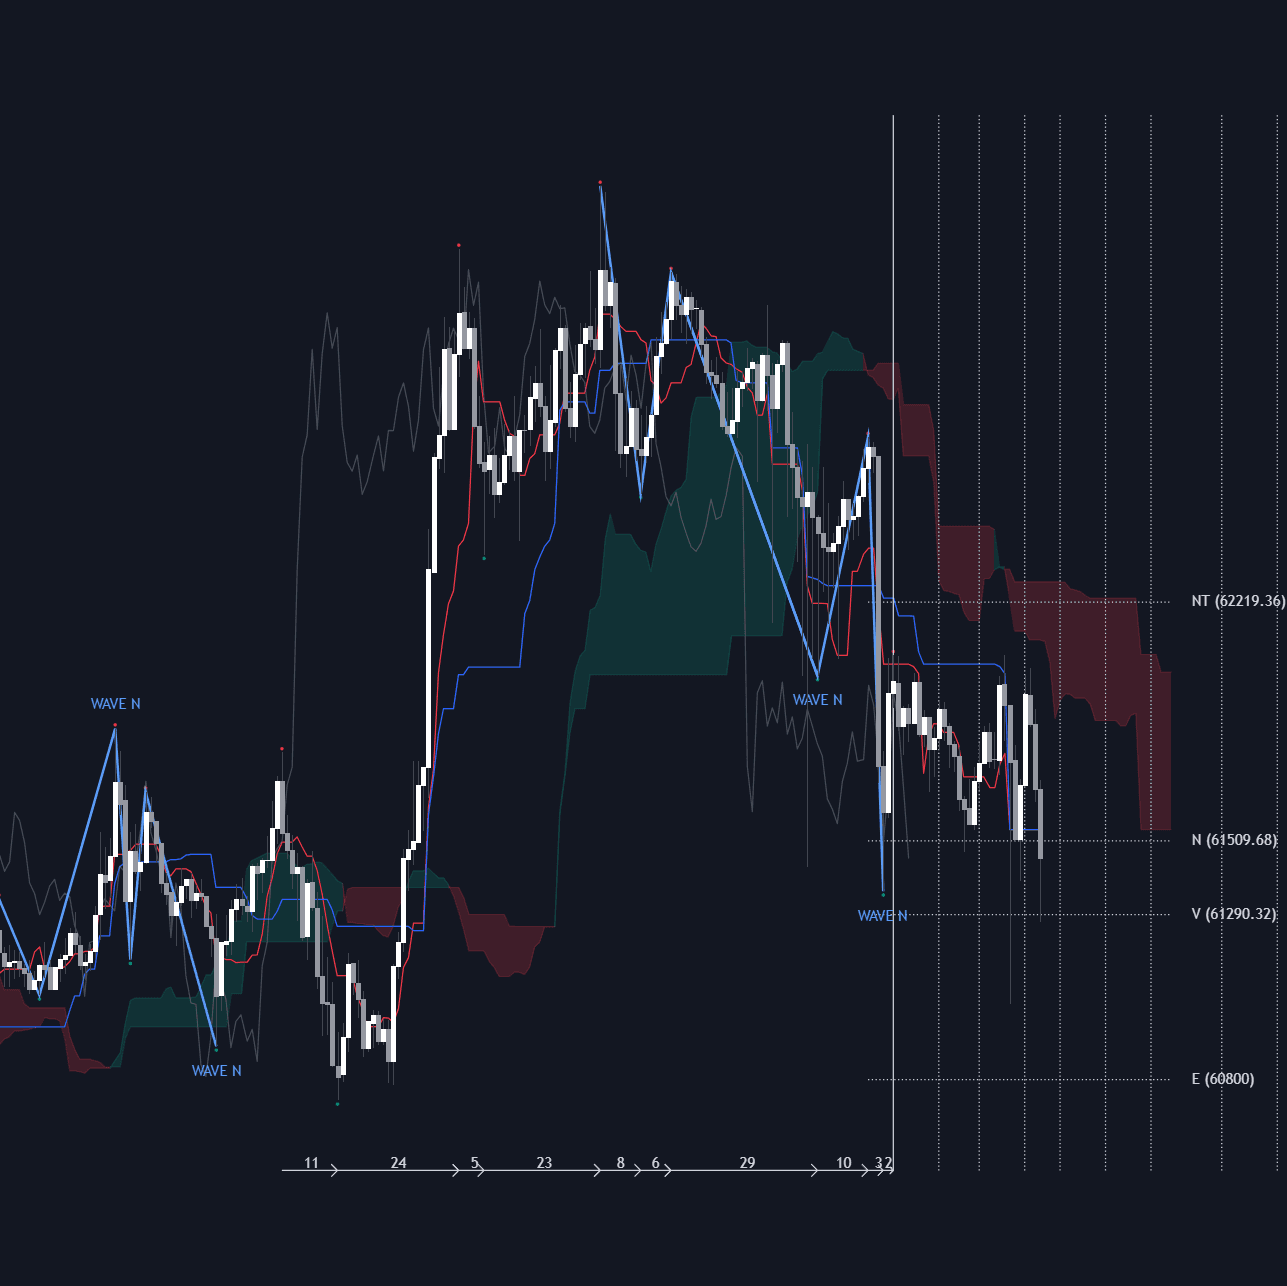
The Ichimoku System (Ichimoku Kinko Hyo, roughly 'one-glance equilibrium chart') is a complete charting method developed by the Japanese journalist Goichi Hosoda and published in 1969 after decades of refinement. It plots five lines built from range midpoints rather than closing-price averages: Tenkan-sen, the midpoint of the last 9 periods' high-low range; Kijun-sen, the 26-period midpoint; Senkou Span A, the average of those two projected 26 periods forward; Senkou Span B, the 52-period midpoint projected the same way; and the Chikou span, the close plotted 26 periods back. The area between the Senkou spans is shaded as the kumo, the cloud.
The midpoint basis is what separates Ichimoku from a moving-average stack. A midpoint moves only when the extremes of its lookback window change, so flat Tenkan or Kijun segments mark genuine equilibrium that price tends to gravitate back toward. Projecting the spans forward turns past equilibrium into a visible future zone, and shifting the close backward asks a blunt question: has current price cleared where the market traded 26 bars ago?
The system matters because it packages trend direction, momentum, support and resistance, and a confirmation check into one overlay with a shared vocabulary: TK cross, kumo breakout, kumo twist. It is one of the few widely used frameworks that is genuinely a system rather than an indicator, and its parts are routinely borrowed piecemeal, the Kijun-sen in particular serving as standalone dynamic support and resistance.
How to read the Ichimoku System
Ichimoku is read in layers, from the regime backdrop down to the trigger.
- 1Locate price relative to the cloud: above the kumo is a bullish regime, below is bearish, inside is transition. Cloud thickness proxies how much prior equilibrium must be absorbed for the regime to change.
- 2Check the short-term order: Tenkan above Kijun is bullish momentum, below is bearish. TK crosses are graded by location, strongest when they fire on the regime's side of the cloud and weakest when they fire against it.
- 3Look at the projected cloud ahead of price: its color (Senkou A above or below B) shows the developing bias, and a twist, where the spans cross, marks where the backdrop is set to flip.
- 4Confirm with the Chikou span: for longs, the lagging span sitting clear above the candles 26 bars back means current price has escaped that congestion; a Chikou tangled in old price warns the path is contested.
How it's calculated
Ichimoku combines five lines built mainly from period midpoints (the average of the highest high and lowest low over a window), with two spans projected forward to form the cloud.
Hosoda's defaults are 9, 26, 52 with a 26-bar displacement; some platforms offset plots by 25 bars so the current bar counts as the first of the 26.
Price above the Kumo is conventionally read as an uptrend and below as a downtrend, with the relative order of the spans setting the cloud color.
How traders use it
- As a regime filter: entries come from faster tools but are taken only in the direction of price versus the cloud, effectively using Ichimoku as a higher-timeframe trend filter even on a single chart.
- As an entry engine: graded TK crosses, kumo breakouts, and Kijun bounces form a codified rule set, covered separately under Ichimoku Signals.
- As a mean-reversion anchor: stretched distance from the Kijun-sen is commonly faded back toward it, and pullbacks to a rising Kijun are a standard trend-continuation entry.
- As forward support and resistance: because the cloud is projected, its edges exist before price arrives, giving pre-drawn levels for targets, stops placed behind the far span, and timing windows around twists.
Ichimoku System vs related tools
Ichimoku Signals: This page covers the chart itself: the five lines and how to read them together. Ichimoku Signals covers the discrete, graded entry rules (TK cross, kumo break, Chikou confirmation) built on top of the chart.
Donchian Channels: Both are built from highest-high and lowest-low lookbacks. Donchian plots the envelope extremes themselves; Ichimoku plots the midpoints of those ranges and projects the two Senkou spans forward in time.
Moving Average Crossovers: A TK cross looks like an MA cross, but the lines are range midpoints, so they flatten at equilibrium instead of drifting, and the cross is graded by its position relative to the cloud rather than taken at face value.
Supertrend: Both supply an always-on regime read. Supertrend is a single ATR-offset flip line, while the Ichimoku cloud is a projected equilibrium zone with thickness, color, and a separate confirmation span.
Concept family
Trend
100 concepts mapped · 100 in the Library
Ichimoku System FAQ
Turn Ichimoku System into a trading strategy.
Take any implementation from this page into Quant, then build on it, backtest it on real data, and keep refining it in conversation.