Market Regimes Explained: Build Winning Trading Strategies
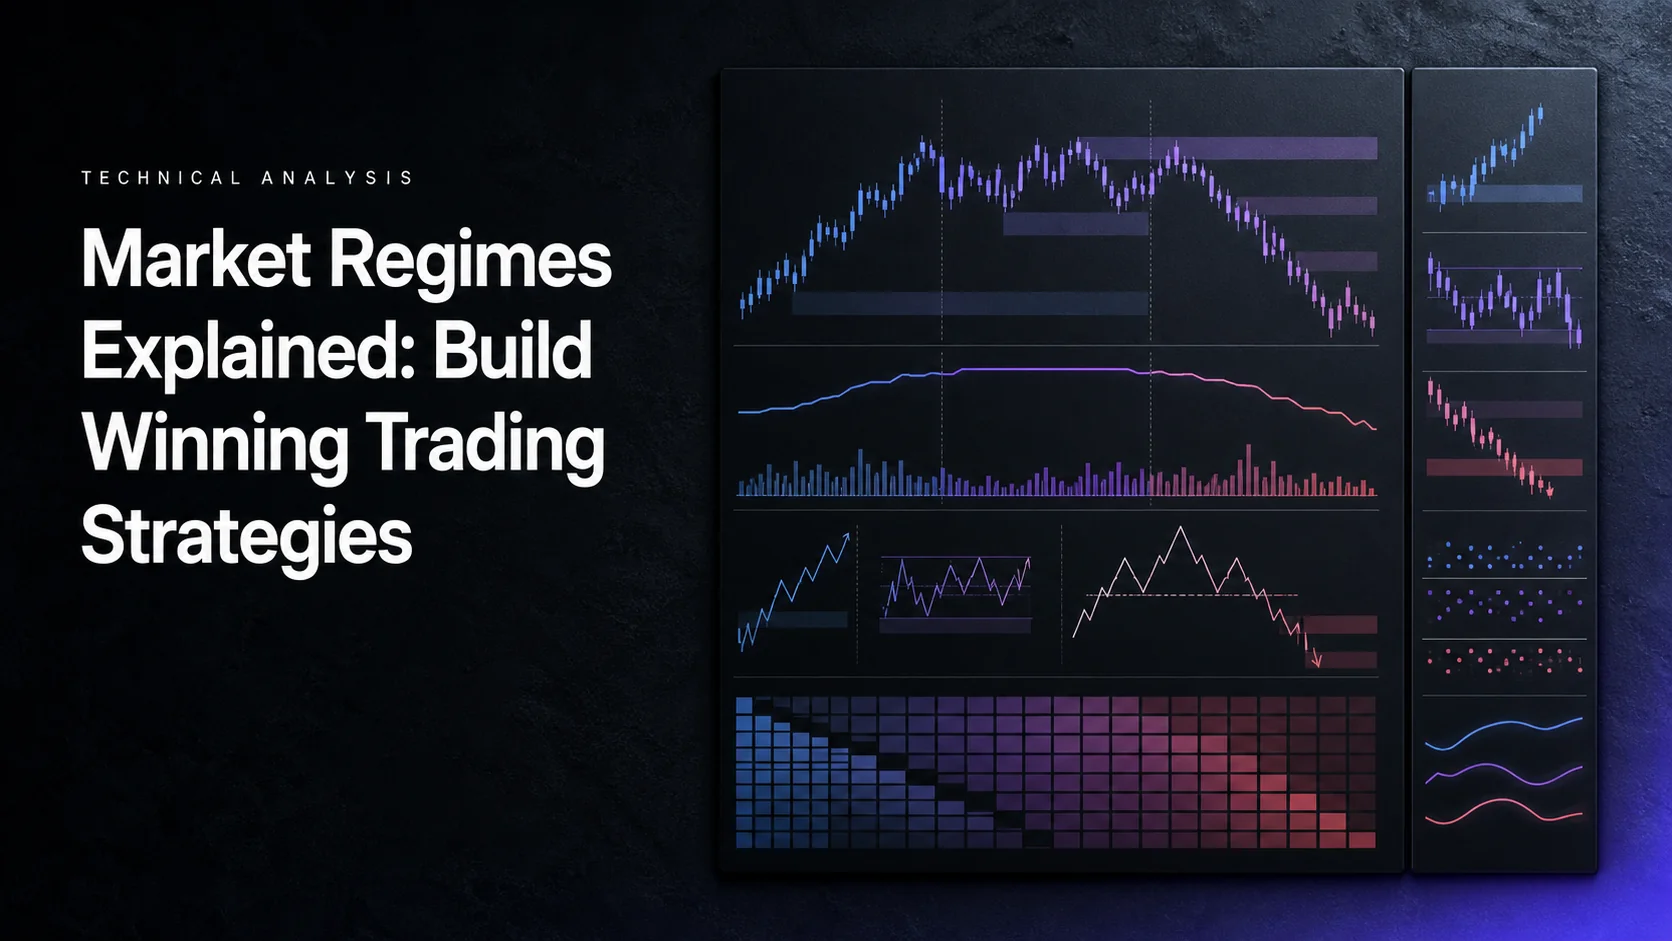
A market regime is a defined description of market behavior over a chosen horizon. It might describe direction, volatility, liquidity or the way price rotates around an average. The purpose is to make strategy decisions testable: what changes when the environment changes, and does that change improve results after costs?
Regimes are estimates, not permanent market identities. A stock can trend upward on a daily chart while moving sideways intraday. A high-volatility market can trend strongly or swing repeatedly in both directions. Separating these dimensions is more useful than assigning one label such as “bullish” to every decision.
LuxAlgo’s charting and AI platform provides a practical workflow. Inspect price and native regime indicators on Quant Charts, then ask Quant, our coding agent, to help implement the classifier, strategy rules and risk controls. Test the complete process, including delays and mistaken classifications, before treating a regime filter as an improvement.
Four Useful Market-Regime Descriptions
Trending, range-bound, high-volatility and low-volatility are useful descriptions, but they are not four mutually exclusive boxes. The first two describe directional behavior; the latter two describe the magnitude of movement. A good classification states both the measure and the timeframe.
Trending Markets: Bull and Bear Trends
An uptrend can be defined by higher confirmed swing highs and lows, a rising moving average or another explicit directional rule. A downtrend reverses those conditions. Bull and bear narratives may include economic context, but a short-term trend signal does not by itself establish a broad economic bull or bear market.
Trend-following models seek to participate in persistent moves using tools such as moving-average crossovers, MACD, Ichimoku or breakout rules. Pullbacks and reversals still occur, and the entry can arrive late. A strong historical trend does not prove that it was identifiable early enough to trade profitably.
Sideways Markets: Range-Bound Conditions
A range-bound model might require repeated movement between defined support and resistance or frequent crossings of an average. Mean-reversion strategies attempt to trade movement back toward a reference level, but that reference can shift and the range can break.
Define the boundaries using information available at the time. A chart that eventually looks like a neat range can have appeared ambiguous while it developed. False breaks, transaction costs and the distance to the intended target matter; “sideways” does not automatically mean low risk or a high win rate.
High and Low Volatility Can Accompany Either Direction
High volatility means larger measured fluctuations relative to the selected comparison. It can accompany a sustained rally, a selloff or turbulent sideways trading. Low volatility means smaller fluctuations under that measure; it can coexist with a gradual trend or quiet congestion.
Scalping is not automatically effective in high volatility, and options trading or long-term investing is not automatically attractive in low volatility. Spreads, slippage, gaps, option pricing and the specific entry/exit model determine whether an opportunity is tradable. A quiet period can also end abruptly.
| Direction / volatility | What it describes | Strategy hypothesis | Main failure to test |
|---|---|---|---|
| Trend + lower volatility | Directional progress with relatively small fluctuations | Trend entries or pullback continuation | Late entries and abrupt expansion against the position |
| Trend + higher volatility | Directional movement with large swings | Trend logic with explicit risk/exposure limits | Gaps, costly fills and repeated stop-outs |
| Range + lower volatility | Rotation within relatively narrow boundaries | Mean reversion if costs leave enough room | Small targets consumed by spread and fees |
| Range + higher volatility | Wide two-sided swings without persistent direction | Selective reversion or staying flat | False breaks and rapidly changing boundaries |
Use VIX for the Question It Measures
Cboe describes VIX as a measure of expected near-term S&P 500 volatility derived from SPX option prices. It is not the realized volatility of every stock, a directional forecast or a universal regime detector for forex and crypto.
Thresholds such as VIX above 25 or below 15 can be research choices, but they do not establish that mean reversion works above one level and trend following works below the other. Compare them with the strategy’s own data and horizon. The level of implied volatility is also different from whether that volatility is expensive or cheap relative to what later occurs.
ATR, realized return volatility and Bollinger Band width measure different aspects of price movement. ATR is in price units; a normalized ratio or percentile can make comparisons more interpretable. Keep the lookback and timeframe consistent and avoid comparing a $5 ATR on one stock with a $1 ATR on another as though the first were necessarily riskier in percentage terms.
How to Identify Market Regimes
Technical Indicators Describe Different Features
ADX measures directional-movement strength, not direction. A reading above 40 is often described as strong and a reading below 20 as weak, but those thresholds are conventions to test rather than automatic trade instructions. A low ADX does not prove that a stable range exists, and a high ADX can remain elevated as a move changes direction.
Aroon tracks how recently the highest high and lowest low occurred over its lookback. RSI measures relative momentum: above 70 or below 30 identifies an extreme under that calculation, not a guaranteed reversal. Strong trends can remain overbought or oversold. MACD describes relationships between moving averages; its crosses and divergences need explicit definitions.
Use the StockCharts ADX guide and RSI guide for the underlying interpretation. Combining several price-derived indicators does not necessarily provide independent confirmation. Compare each added condition with an unfiltered baseline.
Price Action Also Has Confirmation Timing
Higher highs and lows, lower highs and lows, and repeated boundary tests are useful structural observations. Specify what counts as a swing, how many bars confirm it and whether a break requires a wick penetration or a close. A pivot labeled on an earlier candle may only become knowable after later candles.
Break of Structure (BOS) and Change of Character (CHoCH) describe events relative to a chosen structure rule. They can support a continuation or reversal hypothesis; they do not confirm the future path. Different swing lengths can produce different labels on the same chart.
Multi-timeframe analysis can reveal conflicting conditions, such as intraday rotation within a daily uptrend. Decide which timeframe controls entries, risk and exits. A developing daily candle cannot be treated as its final close during an intraday backtest. Price action is direct observation, but its interpretation is not free from confirmation delay or hindsight.
Inspect a Committed Volatility State on Quant Charts
The native Volatility Regime Switches indicator classifies conditions as Quiet, Normal or Stressed. It can use ATR, realized volatility or Bollinger Band width, normalized against its own baseline. The label is a volatility state, not a bullish/bearish signal or an entry order.
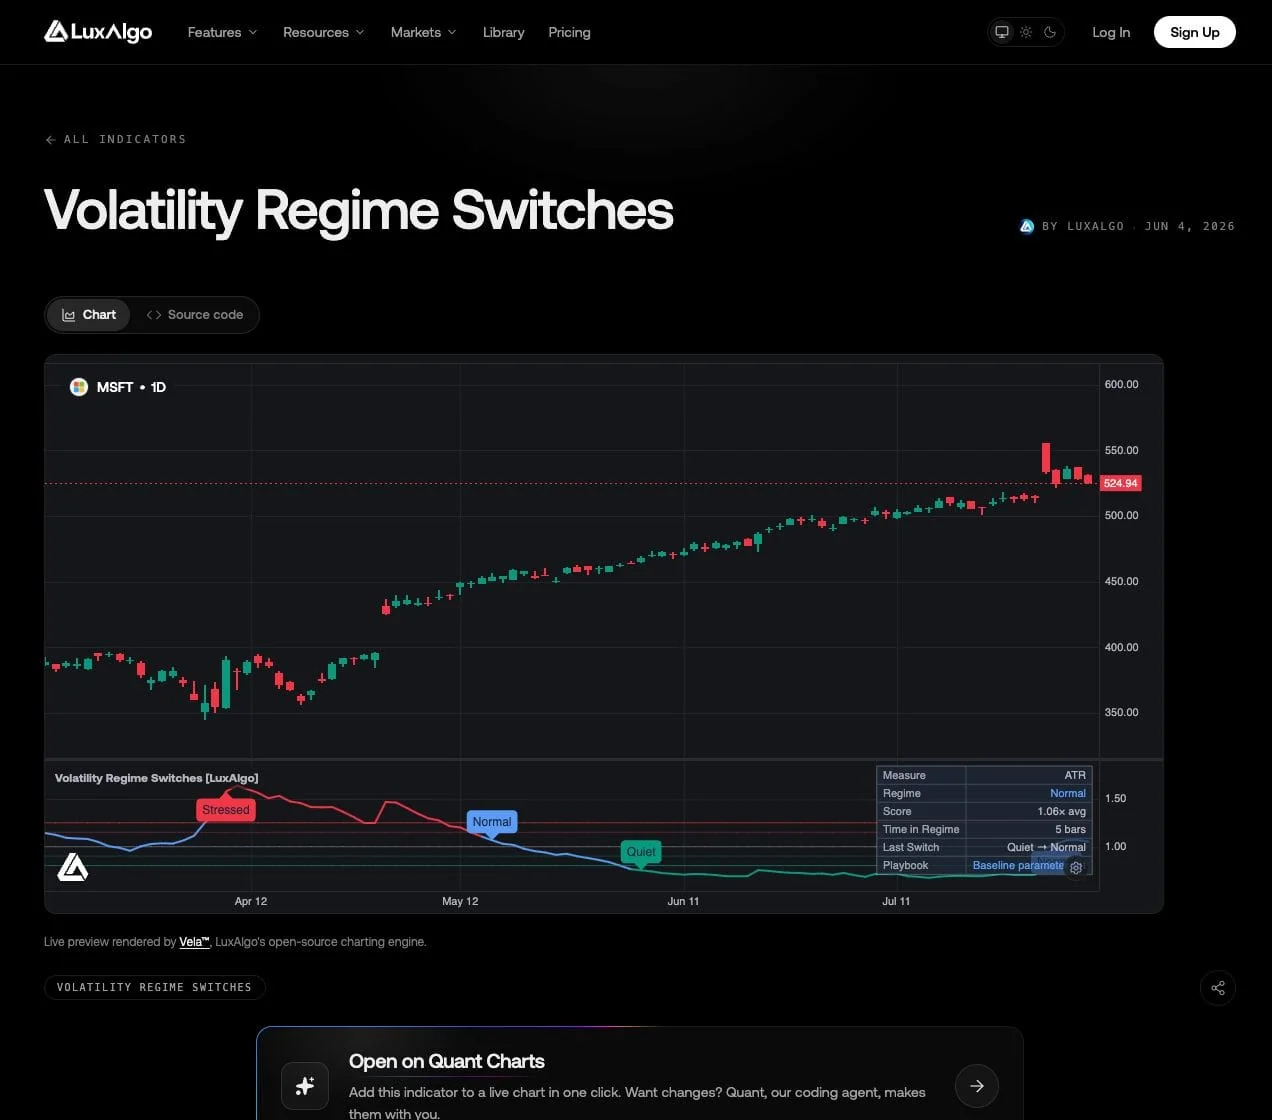
Documented defaults use ATR with a 14-bar measurement length, a 100-bar baseline and Ratio to Average normalization. The stressed and quiet thresholds are 1.25 and 0.80, with a 0.10 hysteresis buffer. A candidate must persist for two confirmation bars, and evaluation on closed bars is enabled by default.
Hysteresis means the conditions for entering and leaving a state differ. The buffer can reduce rapid switching near a threshold, at the cost of a delayed response. Percentile mode instead uses a 0–100 rank, with documented 80/20 thresholds and a 10-point buffer. A percentile of 80 is a relative rank, not an 80% forecast that price will rise.
Inspect the committed state and selected settings rather than triggering from the first volatility spike. With ATR of $2.50 and an illustrative $2.00 baseline, the ratio is 1.25; whether a switch commits also depends on the previous state, buffer and confirmation logic. A ratio alone is not the entire state machine.
Use an Intraday Classifier for an Intraday Question
VWAP Mean-reversion vs Trend Regimes addresses a different question: whether recent session behavior looks rotational or trending around VWAP. Its composite uses crossings, side hold, slope and stretch. The documented defaults include a 48-bar evidence window and 12 bars of minimum evidence.
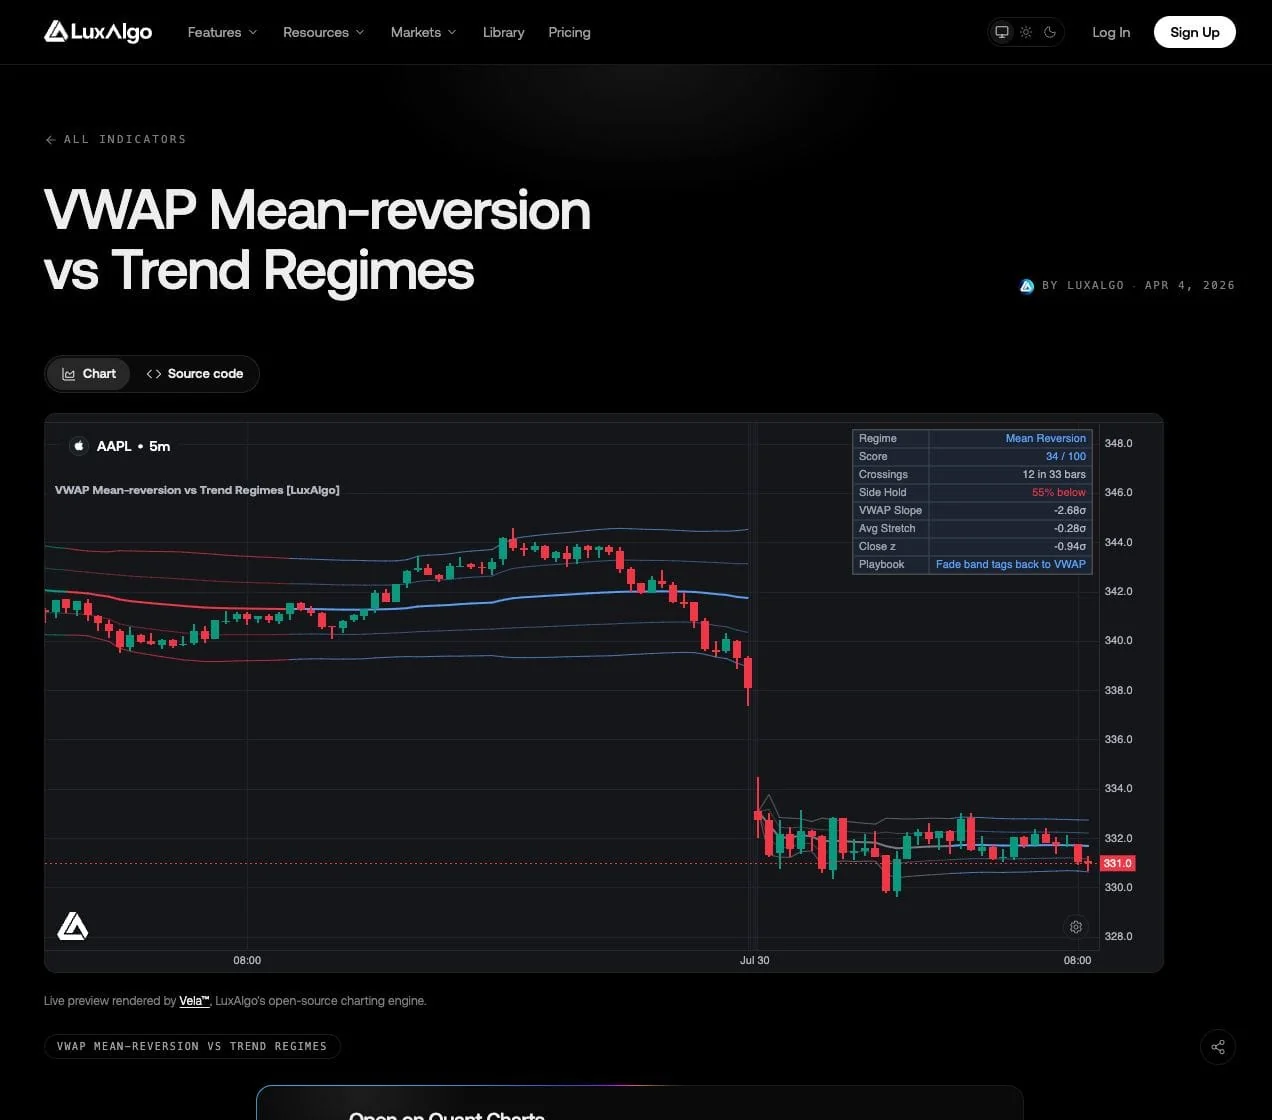
The default trend threshold is 65 and the mean-reversion threshold is 35; the interval between them retains the previous label. Before enough evidence exists, the state is Developing. On five-minute bars, 12 completed bars represent 60 minutes of eligible observations, while 48 bars represent four hours; missing bars or session boundaries still need handling.
The volatility and VWAP tools may disagree without either being defective: one measures movement magnitude relative to a baseline, while the other evaluates intraday directional persistence and rotation. Record which classifier controls which decision rather than forcing every indicator to show the same word.
Advanced Methods: HMMs and Regime-Switching Models
A Hidden Markov Model (HMM) assumes observed data are generated by unobserved states connected through transition probabilities. States may have different return distributions or volatility. The model estimates which state is plausible under its assumptions; it does not reveal an objective market identity.
The hmmlearn tutorial explains fitting, transition probabilities, decoding and convergence. State numbers have no permanent economic meaning: a refitted state 0 need not remain “bearish.” Inspect fitted means, variances and other characteristics before naming states, and check that the mapping stays consistent after retraining.
Live decisions must use information available through the decision bar. Smoothed historical probabilities can use later observations and make past regimes look cleaner than they were in real time. Fitting the model or normalizing features on the full sample also leaks information into earlier decisions. LuxAlgo’s HMM and Markov-switching reference explains this distinction; verify the implementation rather than assuming every colored regime chart is causal.
Louis Szeto’s September 2024 QuantConnect micro-study provides a concrete example: a three-component HMM, five-minute returns and a universe of the ten largest U.S. stocks by market capitalization. The current article reports a Sharpe ratio of 1.9 and a tested parameter range of 1.1–1.9. These are the author’s historical research results, not an independently reproduced or current live performance record.
The earlier combination of 36% return, 1.7 Sharpe and 7.3% maximum drawdown should not be treated as a verified result for that current implementation. Reproduce the exact version, dates, universe, costs and state mapping before relying on its statistics. Compare with a simple exposure-matched baseline; a profitable backtest does not establish that the classifier caused the profit.
Regime-switching regressions and machine-learning models can incorporate macroeconomic inputs such as inflation or unemployment. Use the values actually published at the decision time, including release delays and revisions. A claim that a random forest explained 96.75% of variance needs its dataset, target, evaluation method and original study; it is not a universal accuracy rate or evidence of profitable trades.
| Method | Useful output | Main implementation burden | What to verify |
|---|---|---|---|
| Indicator rules | Transparent thresholds and state labels | Lookbacks, timing and threshold choice | Whipsaw, delayed recognition and incremental benefit |
| Price structure | Swing sequence, range and break events | Consistent pivot and break definitions | When each label first became knowable |
| HMM / switching model | Estimated state probabilities and transitions | Fitting, feature preparation and state mapping | Causal probabilities, convergence and stability after refits |
| Supervised ML / macro model | Prediction of a defined label or target | Training labels, release-time data and validation | No future information; out-of-sample performance versus baseline |
Matching Trading Strategies to Market Regimes
Test a Strategy in the State It Is Meant to Trade
Trend following, mean reversion and breakout trading are families of rules, not fixed win-rate profiles. Trend strategies do not universally win 20–40% of trades, and mean-reversion strategies do not universally win 80–85%. Holding periods and stop distances depend on the actual model and instrument.
| Strategy family | Regime hypothesis | Entry / exit example to define | Key test |
|---|---|---|---|
| Trend following | Directional persistence may reward staying with a move | A confirmed moving-average condition with a specified trailing exit | Do occasional larger wins compensate for whipsaw and costs? |
| Mean reversion | Rotation around a stable reference may support fades | A defined deviation entry with invalidation and a return-to-reference exit | What happens when the reference shifts or the range breaks? |
| Breakout | Expansion from a defined range may persist | A completed break plus fixed risk and failure rules | Are failed breaks and late fills included? |
| Volatility-aware allocation | Exposure changes may control fluctuations | A predeclared risk budget, stop model and size cap | Does it improve the portfolio after turnover and transition losses? |
Win rate alone is insufficient. In a hypothetical model winning 30% of trades at 3R and losing 70% at 1R, expectancy is 0.30 × 3R − 0.70 × 1R = +0.20R before costs. Another model winning 85% at 0.3R and losing 15% at 2R has 0.85 × 0.3R − 0.15 × 2R = −0.045R. A high win rate can conceal unfavorable loss size.
Adapt Risk with Correct Sizing
High volatility does not call for universally tighter stops, nor does low volatility call for universally wider stops and larger positions. Choose the invalidation rule first, calculate the distance to the actual entry, and size the position to a defined cash-risk budget. Recalculate when the planned stop distance changes.
For a $50,000 account with an illustrative 0.5% budget, planned price risk is $250. If the strategy uses a stop two ATRs away, an ATR of $1 implies $2 risk per share and 125 shares. An ATR of $2 implies $4 risk per share and 62 whole shares, or $248 planned risk. This holds the cash budget approximately constant while the stop distance changes.
At a $100 entry, those positions have $12,500 and $6,200 of notional exposure. If the 125-share trade planned to stop at $98 instead fills at $97, the loss is $375 before fees, or 0.75% of the account. The budget is a planned loss to a price, not a guarantee against gaps or poor fills.
Use minimum liquidity requirements and maximum exposure limits so a tiny ATR does not imply an oversized position. Multiple strategies can share the same underlying market risk; three positions each risking 0.5% are not automatically diversified. Review aggregate exposure and how correlations change under stress.
Avoid Switching Strategies with Hindsight
A regime-aware approach can fail by changing models too often, misclassifying transitions or choosing a new strategy after every loss. A single diversified strategy can sometimes outperform a complicated switching system. Keep that simple baseline in the comparison instead of assuming adaptation is always better.
Define whether a state change affects new entries only, exits existing positions or changes size at the next rebalance. Include the cost of that action. If the rule switches after two completed bars, do not backdate the new strategy to the first bar of the move.
Use an explicit uncertain or developing state when evidence is weak. You might preserve the existing risk plan, reduce exposure or block new entries under a tested rule. Do not force a strong label merely because a dashboard expects one.
Build and Test Regime-Aware Strategies with Quant
Start with a written hypothesis such as “allow this pullback strategy only when a specified trend condition is confirmed, and reduce its risk budget in a committed Stressed volatility state.” Define the base strategy first, then add the regime rule so its contribution can be measured.
Follow Making Strategies with Quant: ask Quant to help implement the definitions, inspect Code and click Run yourself. Use the native backtest guide to review inputs, costs, the trade list and summary statistics. Confirm that the chosen indicators and data are available in the intended runtime; a Python HMM example is not automatically executable as a native chart strategy.
Compare at least the unchanged strategy, the filtered strategy and a simple exposure-matched baseline. Report performance by the regime known at entry, then separately inspect transition periods. A strategy with fewer trades may show a higher win rate while producing less total return or less reliable evidence.
For a numerical attribution example, suppose an unchanged test makes 100 trades totaling +12R before costs. A filter removes 40 trades totaling −4R, leaving 60 trades totaling +16R. At 0.1R cost per trade, the totals are +2R for the baseline and +10R for the filter. That historical improvement still needs untouched data; choosing the filter because it removed those exact losses is selection bias.
Use chronological train, validation and final evaluation periods, or a defined walk-forward schedule. Fit thresholds, normalization and models only within each training window. Track nearby parameter values and include the time and turnover needed to retrain or switch. A monthly review can be useful; monthly re-optimization is a separate rule that must also be tested.
Keep LuxAlgo Product Roles Clear
The Library indicators shown here run on Quant Charts alongside its trend, structure and momentum tools. A volumetric order block or a CHoCH label is not interchangeable with a calibrated market-regime probability.
Historical database size and a plan name do not establish which parameters will be optimal in the future. Use current LuxAlgo pricing for access details, and evaluate each result as a historical test with explicit assumptions. AI assistance can speed implementation and iteration; it does not keep a strategy profitable automatically.
Practical Tips for Monitoring Market Regimes
Configure Alerts Around Decisions
Alert frequency should match the rule and the time you can respond, not a universal quota for each market type. A daily classifier and a five-minute entry model need different evaluation schedules. Where supported, use completed-bar evaluation, persistence, cooldowns and duplicate suppression to avoid repeated messages around the same threshold.
| Condition to monitor | Example alert event | Decision to define in advance |
|---|---|---|
| Trend state changes | A completed-bar direction rule changes state | Whether to permit new entries or review existing positions |
| Volatility state changes | Quiet, Normal or Stressed commits after confirmation | Whether to change future risk budgets or block new trades |
| Intraday context develops | Minimum evidence is reached or VWAP regime flips | Whether the selected playbook becomes eligible |
| Data or execution problem | Missing data, stale inputs or an unavailable session | Whether to suspend the strategy and investigate |
There is no general requirement for 15–20 alerts in trends, 20–25 in high volatility or a fixed 0.5–1.5% price threshold. Calibrate any movement buffer to the instrument and horizon, and measure the delay it adds. An alert informs a decision; it is not a guarantee of delivery, execution or protection.
Diversify by Behavior and Risk
Several strategy names can conceal the same exposure. A breakout system, moving-average crossover and momentum model might all lose together in a reversal. Compare correlations, overlapping positions, drawdown timing and costs. Adding an independently tested mean-reversion model can diversify behavior, but it can also introduce a new source of tail loss.
Keep a Record of What Was Known
For each decision, store the symbol, timeframe, classifier version, input values, committed state, signal time and resulting action. Review missed trades and false switches alongside the best examples. If a model is revised, retain the previous version so later analysis does not overwrite what you actually knew.
Claims that regime adaptation universally raises risk-adjusted returns by 10–30% while cutting drawdowns by a similar amount need specific strategies, datasets and costs. Treat improvement as a result to demonstrate against a baseline, not an assumed benefit of adding a classifier.
Market Regimes Video Explainer
The existing video offers another introduction to market regimes. Evaluate its examples and rules against your own data; identifying a state does not provide a method for beating every market.
Make Regime Awareness Measurable
Choose a small number of observable features, define when a state becomes actionable and specify how it changes the strategy. Use Quant Charts to inspect the conditions and Quant to help test the complete decision process. The evidence to look for is better behavior after costs on data the model did not use to choose its rules.
FAQs
What are the main types of market regimes?
Trending and range-bound describe direction and persistence, while high and low volatility describe movement magnitude. These dimensions overlap, so a market can be trending with either high or low volatility.
Does a high VIX mean mean reversion will work?
No. VIX reflects expected near-term S&P 500 volatility from option prices. A threshold is a testable filter, not proof that a particular strategy will be profitable.
Are regime scores the same as trade probabilities?
No. A normalized volatility ratio, percentile rank or composite score is not automatically a probability of a winning trade. Read the classifier’s definition and test the full strategy separately.
Can HMM regime labels change after fitting?
Yes. State numbering can differ after refitting, and historical smoothing can use future observations. Map states from fitted characteristics and use only information available at the decision time for live rules.
How can LuxAlgo help test different market conditions?
Inspect native regime indicators on Quant Charts. Ask Quant to help implement explicit classifier, entry, exit and risk rules, inspect Code, click Run and compare the trade list and results with an unchanged baseline.
What is a common mistake when adapting to market regimes?
Switching strategies after seeing losses without a predefined rule. Include classification delay, false switches, transaction costs and aggregate exposure in a chronological out-of-sample test.
References
LuxAlgo Resources
- Quant Charts
- Volatility Regime Switches
- VWAP Mean-reversion vs Trend Regimes
- Hidden Markov / Markov-switching Regimes Reference
- LuxAlgo Quant
- Making Strategies with Quant
- Native Backtest Guide
- LuxAlgo Pricing
External Resources
Read next