Concept
Parameter Stability
Parameter Stability, also known as plateaus, sensitivity heat maps, is a Performance, Backtesting & Validation concept. The Library holds 1 implementation, a working definition you can pull into Quant.
Top Parameter Stability indicator
The top custom implementation, built on the original standard Parameter Stability formula.
1 total
This Parameter Stability implementation is strategy-ready: open it in Quant, set your rules, and it backtests automatically.
What is Parameter Stability?
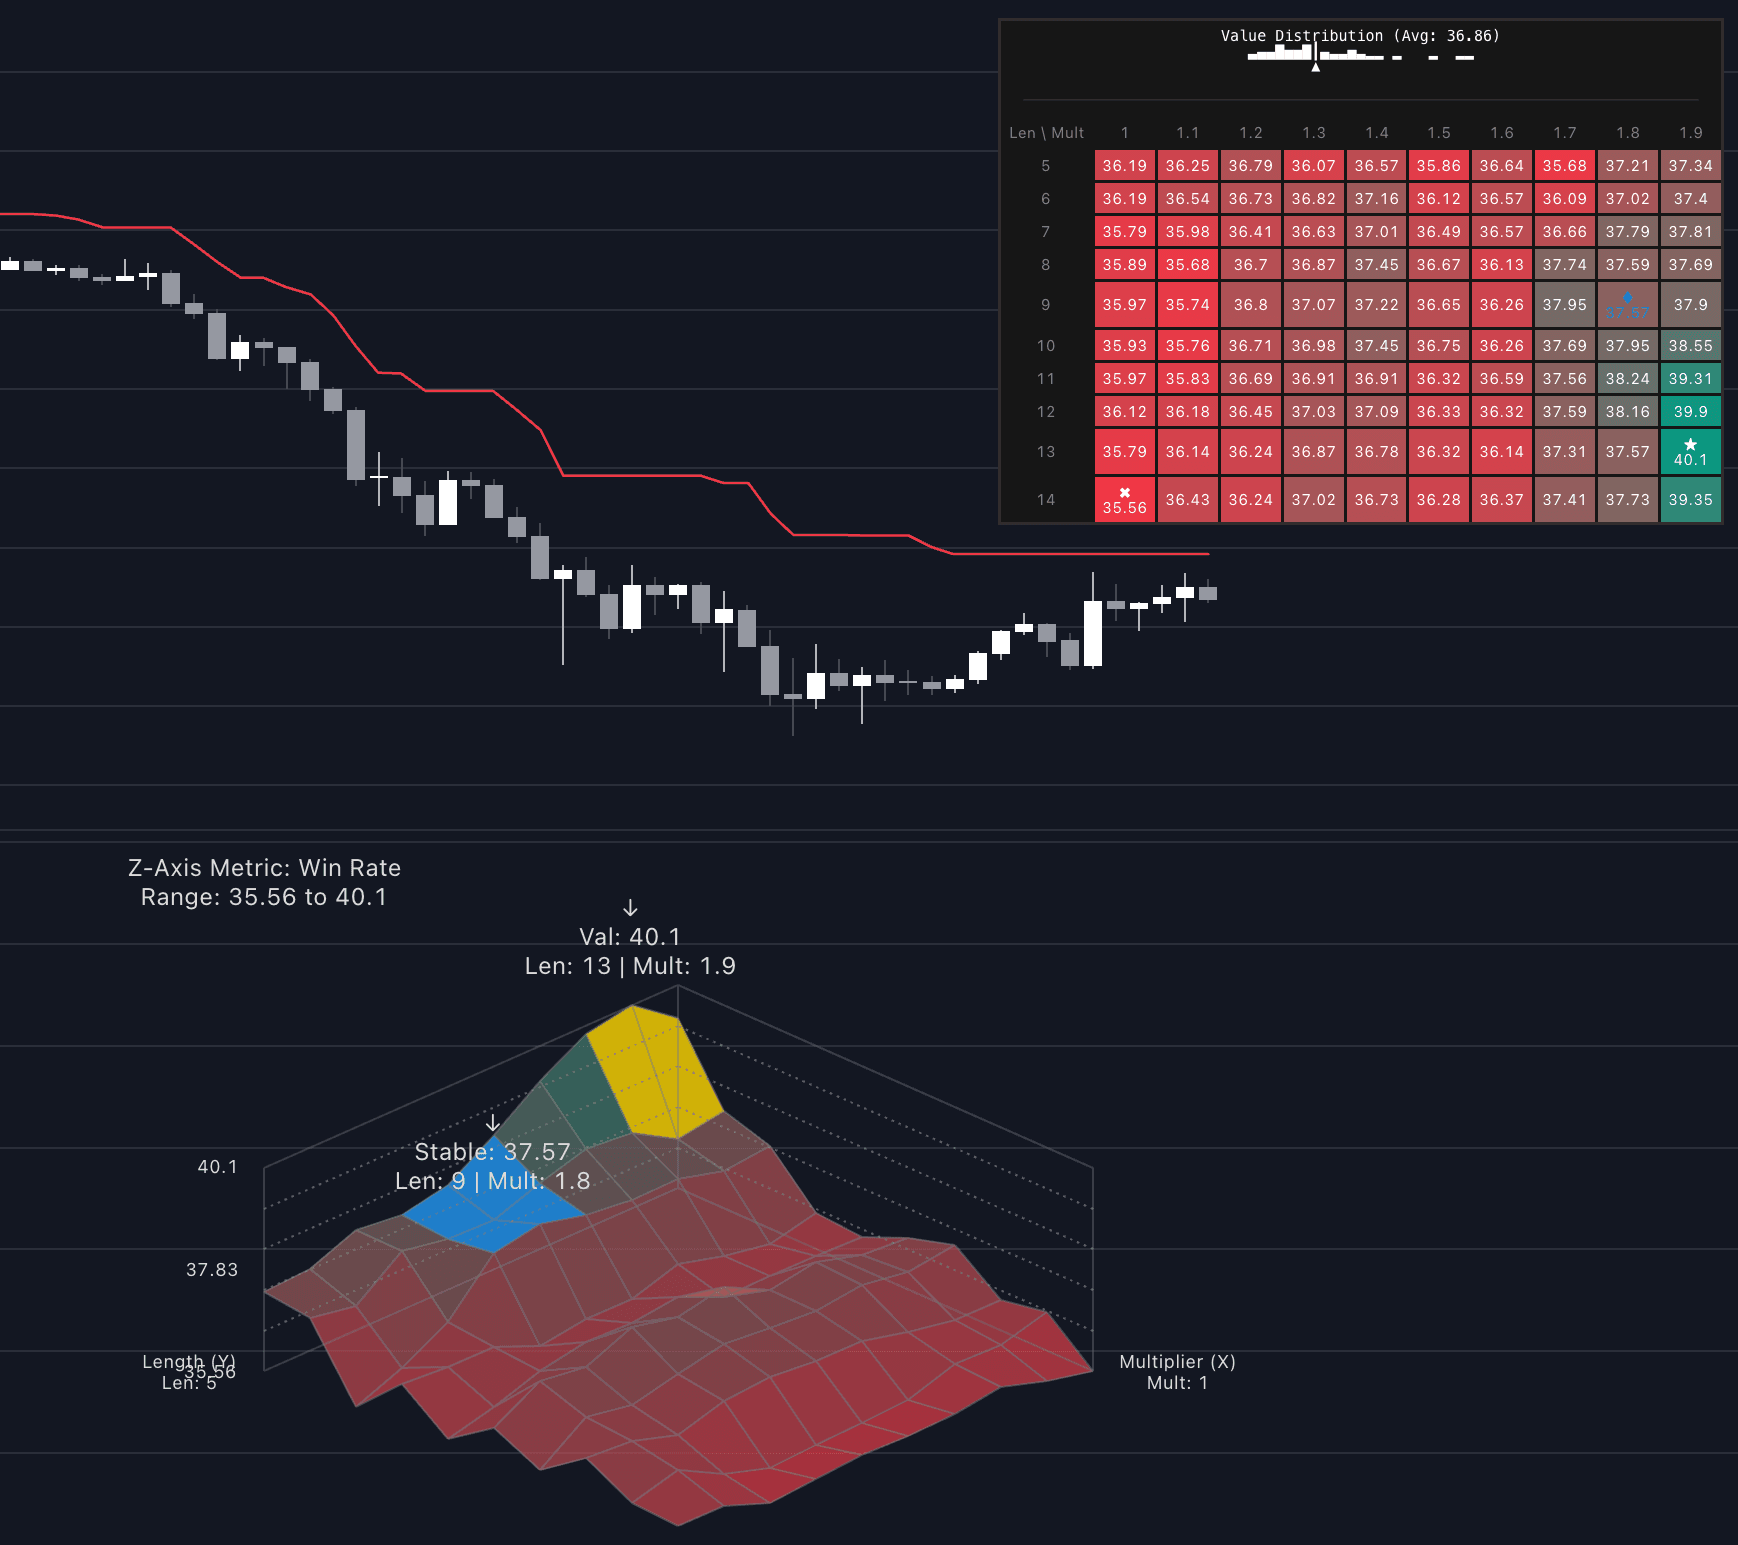
Parameter stability is the property that a strategy's performance changes smoothly as its inputs are varied. If a moving-average length of 20 backtests well, lengths 17 through 24 should backtest comparably: the setting sits on a plateau. When a single value shines while its neighbors fail, the peak is almost certainly noise the optimizer found, since nothing about markets makes 20 fundamentally different from 19. Stable parameters are evidence the edge comes from the idea; a fragile spike is the classic signature of curve-fitting.
The idea grew up alongside computerized backtesting. Robert Pardo's Design, Testing, and Optimization of Trading Systems (1992), the book that popularized walk-forward analysis, was already telling system developers to prefer broad profitable regions over isolated peaks in an optimization space. The modern academic treatment arrived from the overfitting side: work by David Bailey, Marcos López de Prado, and coauthors in the 2010s showed how quickly the best result of a large parameter search degrades out of sample, formalizing what the plateau heuristic had long assumed, that the more configurations are tried, the more impressive the luckiest one looks.
In practice stability is usually inspected visually. A grid scan across one or two parameters plots a metric such as net profit or Sharpe ratio as a sensitivity heat map or 3D surface, and the eye looks for broad ridges rather than isolated spikes. The standard advice is to pick from the middle of a plateau instead of the single best cell, accepting a slightly worse backtest for a more robust setting, then confirm the choice on out-of-sample data.
Two mechanics deserve attention. First, multiplicity: a scan over hundreds of combinations is hundreds of chances for randomness to produce a standout, so an isolated spike is not merely suspicious, it is expected. Second, interaction: parameters rarely act independently, so a plateau in one dimension can hide a knife-edge along a diagonal, which is why two-parameter maps beat one-dimensional sweeps and why the whole surviving region should be inspected, not just its best cell. Stability also generalizes: a robust setting should hold up on related instruments and adjacent timeframes, and its win rate and drawdown character should not transform when the data shifts by a year.
How to run a parameter stability check
The check is a scan and a picture rather than a chart pattern:
- 1Choose one or two parameters that drive the strategy and define a grid around the candidate values, stepping in increments a user might plausibly pick.
- 2Backtest every combination on the same data, recording one or two metrics per cell; a risk-adjusted return measure plus maximum drawdown beats net profit alone.
- 3Plot the results as a heat map or 3D surface and read the shape: broad warm regions are plateaus, isolated bright cells are noise until proven otherwise.
- 4Pick from the center of the widest healthy region, then nudge every parameter one step each way and confirm results stay in family.
- 5Validate the chosen setting on data the scan never touched, since a plateau found in-sample is still an in-sample discovery.
How traders use it
- Grid-scanning a parameter pair and mapping the performance surface; wide warm regions on the heat map mark robust zones, single bright cells mark likely overfits.
- As a selection rule: choose parameter values from the center of a plateau, not the peak of the surface, so ordinary market variation does not push the system off its setting.
- As a tiebreaker between candidate systems: given two similar backtests, the one whose performance survives parameter perturbation is the more trustworthy design.
- As an ongoing health check: live systems are re-scanned periodically, and a plateau that has narrowed into a spike is treated as early evidence that the setting's regime is ending.
- As a walk-forward companion: when each window re-optimizes, stable systems choose similar values window after window, while wandering choices reveal an optimizer chasing noise through time.
Parameter Stability vs other validation checks
In-sample / Out-of-sample Split: The split tests robustness across time: does the tuned system survive data it never saw? Stability tests robustness across settings: does performance survive the inputs moving? A strategy can pass either alone; trustworthy ones pass both.
Sharpe Ratio: The Sharpe ratio scores one configuration; stability examines the landscape of such scores. A brilliant Sharpe on a knife-edge is a weaker claim than a decent Sharpe on a wide plateau, which is why the surface, not the single number, is the exhibit.
Win Rate: Win rate is the outcome of one setting and says nothing about its neighbors. A high win rate whose adjacent cells collapse is precisely the pattern a stability check exists to catch.
Concept family
Performance, Backtesting & Validation
30 concepts mapped · 30 in the Library
Parameter Stability FAQ
Turn Parameter Stability into a trading strategy.
Take the implementation from this page into Quant, then build on it, backtest it on real data, and keep refining it in conversation.