How to Backtest Custom Indicators in MetaTrader
MetaTrader's Strategy Tester backtests Expert Advisors, not indicators, so backtesting a custom indicator means one of two things: running it in the tester's visual mode to check that it draws and updates correctly bar by bar, or wrapping its signals in a small Expert Advisor so the tester can turn them into trades and produce a report. Both are worth doing, in that order. The visual pass catches indicators that repaint, look ahead or fail on missing history; the Expert Advisor pass produces the numbers, and the numbers are only as honest as the tick modelling, spread, execution delay and forward-period settings you choose. This guide follows MetaQuotes' own documentation for MetaTrader 5 through installation, visual testing, the iCustom wrapper, the tester settings that matter, the report fields, optimisation and forward testing, and finishes with how the same workflow looks on Quant Charts, where Quant, our coding agent, writes the strategy for you.
Key points:
- Indicators are tested through an EA: the tester's report comes from trades, so signals must be read with iCustom and CopyBuffer inside an Expert Advisor.
- Tick mode decides realism: Every tick based on real ticks is closest to live conditions; Open prices only is a rough first pass, not a final verdict.
- The report has more than net profit: History Quality, drawdowns on balance and equity, profit factor and recovery factor each answer a different question.
- Forward testing is built in: the tester can optimise on part of the history and test the best runs on the rest, which is the guard against curve-fitting.
Video: Backtesting in MetaTrader 5
Blue Edge Financial published this walkthrough of the MetaTrader 5 Strategy Tester in October 2022. Treat any results shown as illustrations of the workflow rather than as evidence about any strategy.
Installing and Checking the Indicator
What a Custom Indicator Is
A MetaTrader 5 custom indicator is an MQL5 program whose core is the OnCalculate event handler. The tester and the chart call it with the number of bars available and the number already calculated on the previous call, and the function fills one or more indicator buffers that the platform draws. Two properties of that design matter for testing. First, the prev_calculated argument exists so that the indicator recomputes only new bars; an indicator that ignores it and recalculates everything on every tick will be slow in the tester and can hide bugs. Second, any value written to a buffer for a bar that has not closed can change until that bar closes, and any code that reads future bars will look perfect in a backtest and fail live. The Library's MQL programming essentials guide covers the language basics.
Install, Compile, Verify
- Open the platform's data folder from the File menu and place the source or compiled file in the MQL5 folder's Indicators directory (MQL4 for MetaTrader 4).
- Open the source in MetaEditor and compile it; fix any errors and warnings before testing, since a warning about an uninitialised variable is a common source of a backtest that differs from live.
- Refresh the Navigator panel, drag the indicator onto a chart, and confirm it draws and that the Experts and Journal tabs show no errors.
- Run it in the Strategy Tester's visual mode: select the indicator in the tester's program list, choose a symbol and period, and watch it build bar by bar. MetaQuotes documents this mode specifically for checking indicators, including demo versions from the Market.
- Check a few values by hand against a spreadsheet, and check that values on completed bars do not change as new bars arrive; if they do, the indicator repaints and any strategy built on it will overstate its results.
Wrapping the Indicator in an Expert Advisor
To get statistics you need trades, and trades come from an Expert Advisor. The standard pattern is a minimal EA that loads the indicator with iCustom, reads its buffer values with CopyBuffer on each new bar, and places orders according to a rule you define. The EA is where the trading logic lives; the indicator only supplies values. Keep the rule explicit, read completed bars only (index 1 rather than 0), and add the stop, target and sizing before the first run, because a test without a stop tests nothing about risk.
#include <Trade/Trade.mqh>
CTrade trade;
int handle;
input int    Length   = 14;
input double Lower    = 30.0;
input double Upper    = 70.0;
input double Lots     = 0.10;
input int    StopPts  = 400;
input int    TargetPts = 800;

int OnInit()
{
   handle = iCustom(_Symbol, _Period, "MyRsiIndicator", Length);
   return (handle == INVALID_HANDLE) ? INIT_FAILED : INIT_SUCCEEDED;
}

void OnTick()
{
   static datetime lastBar = 0;
   datetime barTime = iTime(_Symbol, _Period, 0);
   if (barTime == lastBar) return;      // act once per new bar
   lastBar = barTime;

   double val[2];
   if (CopyBuffer(handle, 0, 1, 2, val) < 2) return;   // completed bars 1 and 2
   double point = SymbolInfoDouble(_Symbol, SYMBOL_POINT);
   double ask = SymbolInfoDouble(_Symbol, SYMBOL_ASK);

   bool crossUp = val[0] < Lower && val[1] >= Lower;  // val[0] is bar 2 (older), val[1] is bar 1
   if (crossUp && PositionsTotal() == 0)
      trade.Buy(Lots, _Symbol, ask, ask - StopPts * point, ask + TargetPts * point);
}
Three details in that skeleton carry most of the honesty. The EA acts once per new bar rather than on every tick, so the rule is evaluated on closed data. It reads buffer indices 1 and 2, the last two completed bars, never index 0. And the stop and target are attached at entry so the tester's report reflects a defined-risk rule. The CopyBuffer array order deserves care: by default the most recent requested value is at the highest index, so check the direction before writing a crossover condition.
Tester Settings That Change the Result
Open the Strategy Tester from the View menu (Ctrl+R), select the EA, the symbol, the timeframe and the date range, then work through the settings MetaQuotes documents.
| Setting | Options | What to choose and why |
|---|---|---|
| Tick generation mode | Every tick; Every tick based on real ticks; 1 minute OHLC; Open prices only; Math calculations | Real ticks for the final run (closest to live, slow first download); 1 minute OHLC for indicator-driven rules that act on bar close; Open prices only for a quick first sweep, never as the verdict |
| Spread | Current or fixed value in points | Fixed at or above your broker's typical spread for the session you trade; the current spread at test time is not representative |
| Execution delay | None; random (0 to 9 seconds, occasionally longer); fixed; measured ping | Use the measured ping or a fixed value; zero delay flatters any rule that trades on the bar open |
| Initial deposit and leverage | Amount and currency; leverage | Match the account you will trade; margin control depends on both |
| Profit calculation | Deposit currency or pips | Deposit currency for anything you intend to trust; the pips shortcut skips swap, commission and margin control |
| Forward period | No; half; one third; one fourth; custom date | Always set one when optimising; it holds out data the optimiser never sees |
Tick Modes Explained
The tester needs ticks because Expert Advisors run on them, and the documentation describes how each mode supplies them. Every tick simulates ticks from one-minute bars using MetaQuotes' generation scheme, which places a bounded number of reference points inside each minute bar according to its shape and tick volume. Every tick based on real ticks uses the broker's recorded ticks instead, so the spread can change within a minute bar and no simulation is involved; it is the closest to live conditions and the slowest to download the first time, and where tick data is missing for a minute the tester falls back to generation. 1 minute OHLC emulates only the four prices of each minute bar, which is adequate for rules that act on completed bars. Open prices only models the open of each bar of the chart period and is meant for rough estimation. Math calculations downloads no history at all and exists for parameter searches that have nothing to do with price. The rule of thumb follows from the design: a rule that reads completed bars can be developed on 1 minute OHLC and confirmed on real ticks; a rule that depends on intrabar order of highs and lows, such as whether a stop or a target was hit first inside a bar, must be confirmed on real ticks.
Reading the Report
The Fields That Matter
The Results tab of the tester lists dozens of fields. MetaQuotes' testing report documentation defines them, and a handful carry most of the information.
| Field | Definition (per MetaQuotes) | How to read it |
|---|---|---|
| History Quality | Percentage of correct one-minute data; bars with tick volume 1 but differing OHLC, and gaps, count as incorrect | Read first; a low value means the rest of the report rests on bad data |
| Bars and Ticks | Bars generated for the symbol; ticks modelled | Confirms the mode and range actually used |
| Total Net Profit, Gross Profit, Gross Loss | Sum of all trades; sum of winners; sum of losers | Profit factor is gross profit ÷ gross loss; below about 1.2 rarely survives live costs |
| Balance Drawdown Maximal and Relative | Largest peak-to-trough fall in balance, in money and percent | The pain you would have sat through between closed trades |
| Equity Drawdown Maximal and Relative | Same, measured on equity including open positions | Usually deeper than balance drawdown; the honest number for a rule that holds trades |
| Recovery Factor | Net profit ÷ maximum drawdown | How many times the rule earned back its worst loss |
| AHPR and GHPR | Arithmetic and geometric mean change per trade | The arithmetic mean overstates; the geometric mean is what compounding actually delivered |
A Hypothetical Report Walk-Through
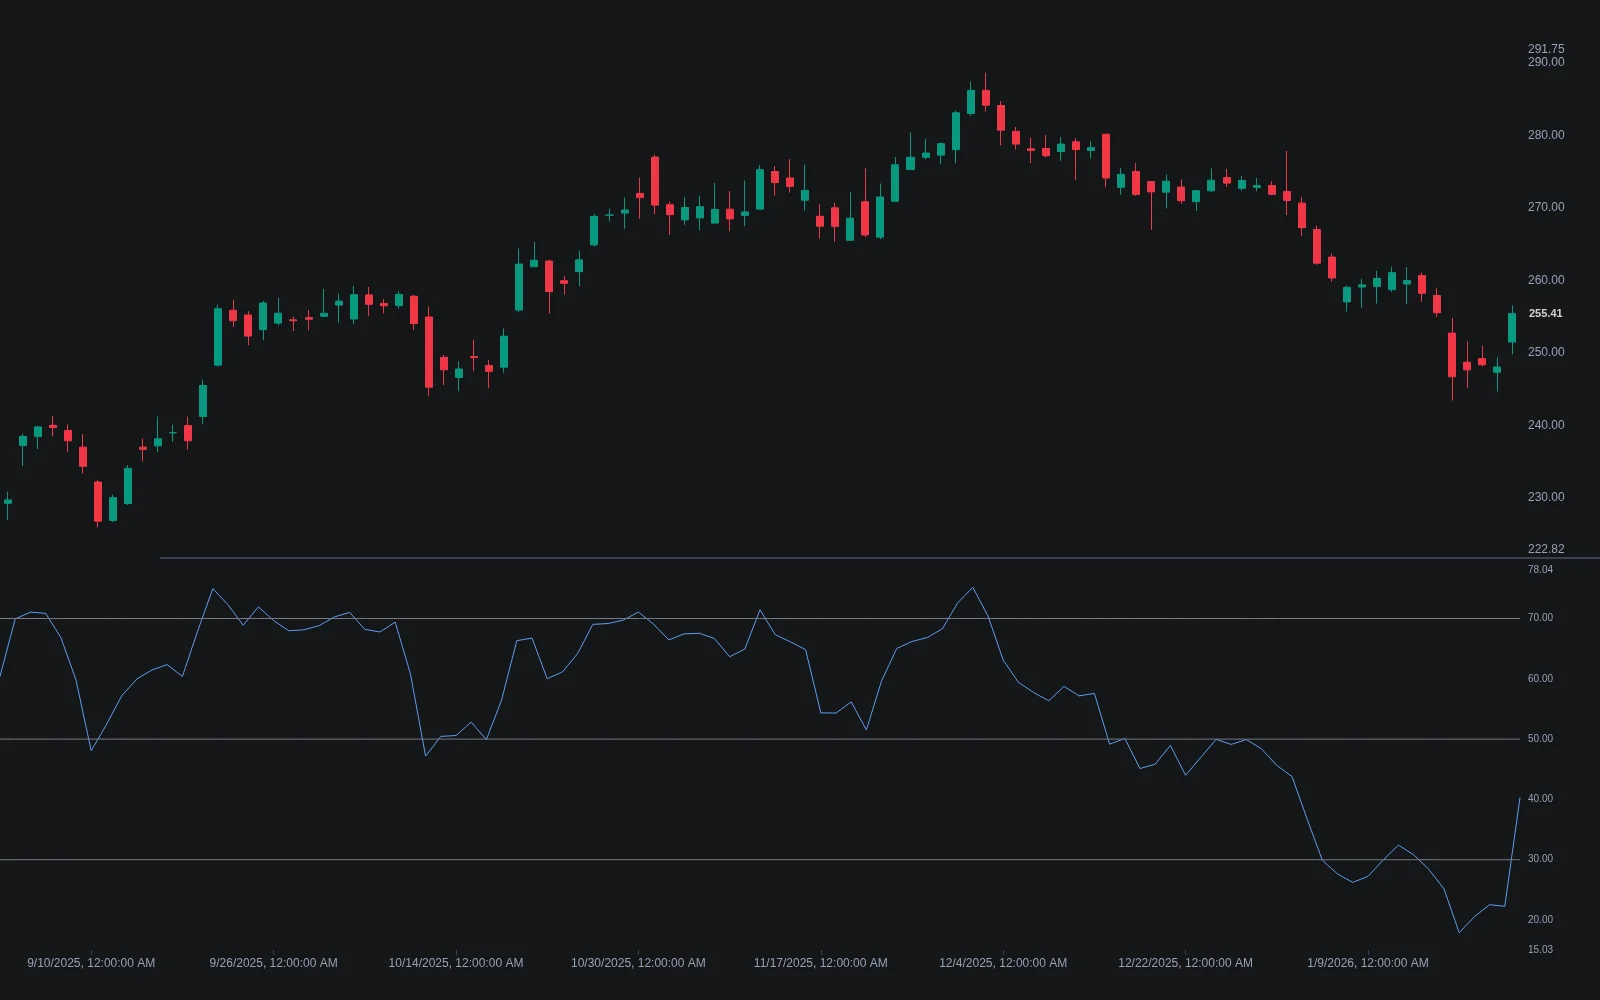
Suppose the RSI-cross EA above runs on two years of one-minute-OHLC data with a $10,000 deposit, a fixed spread and a measured delay, and returns the following figures.
| Field | Value | Reading |
|---|---|---|
| History Quality | 99% | Data acceptable for a bar-close rule |
| Trades | 48 | Two dozen a year; enough to read, not enough to trust fine parameter differences |
| Total Net Profit | $1,240 | 12.4% over two years before any live slippage beyond the modelled delay |
| Gross Profit / Gross Loss | $4,860 / $3,620 | Profit factor 1.34 |
| Balance Drawdown Maximal | $910 (9.1%) | Recovery factor 1.36: the rule earned back its worst drawdown only 1.4 times |
| Equity Drawdown Maximal | $1,180 (11.8%) | Open-trade drawdown deeper than closed-trade drawdown, as expected for an 800-point target |
| Forward-period Profit Factor | 1.05 | The optimised parameters barely broke even on data they never saw; the in-sample 1.34 is mostly fit |
The last row is the one that decides the question. A profit factor of 1.34 in sample and 1.05 forward says the parameters were tuned to the past, and the honest next step is a simpler rule with fewer inputs, not a longer optimisation. Read trades, drawdown and the forward result before net profit, every time.
Optimisation and Forward Testing
The tester offers two optimisation types. The slow complete algorithm runs every combination of the input ranges you select, which is exact and can take a very long time. The fast genetic algorithm searches with a population of 64 to 256 parameter sets over 15 to 31 unconditional generations, keeping the best by the chosen optimisation criterion and stopping when results stop improving; MetaQuotes describes it as almost the same quality at a fraction of the runs. Optimisation can also run across remote agents and the MQL5 Cloud Network. What guards against overfitting is the Forward setting: the date range is split into an optimisation period and a forward period of a half, a third, a quarter or a custom start date, the optimiser runs on the first period, and then 10% of the best runs (full search) or 25% (genetic) are re-tested on the forward period, with both sets of results shown side by side. A parameter set that ranks high in both is a candidate; one that ranks high only in sample is a fit. Our guides on walk-forward testing and backtesting limitations cover the reasoning in depth.
The Same Test on Quant Charts
MetaTrader is one environment for this work; Quant Charts is another, and the workflow is shorter because the strategy is written for you. Describe the indicator and the rule to Quant in plain language, for example the RSI cross above 30 with a 400-point stop and an 800-point target. Quant writes the strategy in Pine Script, plots it on the active chart, and you open Code to confirm the rule reads completed bars, then click Run. The Making Strategies with Quant guide shows the workflow, and the native backtest guide explains the Backtest Summary: net profit, trade count, win rate, maximum drawdown and profit factor, with commission and slippage set in the strategy properties, a full viewer with Performance, Trades Analysis and Trades Log tabs, and the ability to re-run on another symbol or timeframe from inside the viewer as an out-of-sample check.
| Step | MetaTrader 5 | Quant Charts |
|---|---|---|
| Indicator code | MQL5, compiled in MetaEditor | Pine Script written by Quant, or a Library indicator opened on Quant Charts |
| Turning signals into trades | An Expert Advisor with iCustom and CopyBuffer | Quant converts the indicator into a strategy, or the Backtest button does |
| Realism settings | Tick mode, spread, execution delay, deposit, leverage | Commission, slippage, order size, pyramiding and margin in Properties |
| Report | Results tab: net profit, drawdowns, profit factor, recovery factor and more | Backtest Summary strip plus Performance, Trades Analysis and Trades Log |
| Overfitting guard | Forward period on the optimiser | Re-run on other symbols and timeframes from the viewer; hold out recent data |
| Live orders | The EA can trade a connected account | The LuxAlgo platform does not place orders for you |
One further note for traders who work across platforms. The Library publishes the Pine Script® source of its indicators, and PineTS, LuxAlgo's TypeScript implementation of the Pine Script® language, lets that logic run outside TradingView while keeping Pine's execution model, which is useful when an indicator has to be reproduced elsewhere; porting to MQL5 is still a manual job.
Conclusion
Backtesting a custom indicator in MetaTrader is two jobs. The first is proving the indicator itself is sound: it compiles clean, it draws bar by bar in visual mode, and its completed-bar values never change. The second is proving a rule built on it survives honest conditions: an Expert Advisor that reads closed bars, a tick mode that matches what the rule depends on, a spread and delay you would actually face, and a forward period the optimiser never saw. The report will always give you a net profit figure; History Quality, the drawdowns, the profit factor and the forward result are what tell you whether to believe it. On Quant Charts the mechanics are shorter, but the discipline is identical.
Key Takeaways
- Visual mode first. Watch the indicator build bar by bar and confirm completed values never change.
- Wrap it in an EA. iCustom plus CopyBuffer on completed bars, with stop and target attached at entry.
- Match the tick mode to the rule. Bar-close rules can develop on 1 minute OHLC; anything intrabar needs real ticks.
- Read the report in order. History Quality, trades, drawdowns, profit factor, forward result, then net profit.
- Same discipline on Quant Charts. Quant writes the Pine Script strategy; you set costs, inspect Code, click Run and re-test out of sample.
FAQs
Can the MetaTrader Strategy Tester backtest an indicator directly?
Not for profit and loss. The tester runs Expert Advisors and produces its report from their trades; indicators can be run in the tester's visual mode to check that they calculate and draw correctly bar by bar. To get statistics from an indicator's signals, wrap it in a small Expert Advisor that reads its buffers with iCustom and CopyBuffer and places orders by a rule you define.
Which tick generation mode should I use?
MetaQuotes documents five: Every tick, Every tick based on real ticks, 1 minute OHLC, Open prices only and Math calculations. Use real ticks for the final run, since they include the broker's recorded spread changes and involve no simulation; 1 minute OHLC is adequate for rules that act on completed bars; Open prices only is for quick rough estimates only.
How do I know if my indicator repaints?
Run it in the tester's visual mode and compare the values on completed bars as new bars arrive; a repainting indicator changes them. In code, any read of a bar at index 0 or of future bars is a warning sign. A strategy built on a repainting indicator will overstate its backtest and disappoint live.
What do the drawdown fields in the report mean?
Balance drawdown measures peak-to-trough falls in the account balance between closed trades; equity drawdown measures the same on equity including open positions, so it is usually deeper and is the honest figure for a rule that holds trades. Both are reported as absolute, maximal and relative values. Recovery factor divides net profit by the maximum drawdown.
How does forward testing work in the Strategy Tester?
Set a Forward period of a half, a third, a quarter or a custom start date. The optimiser runs on the earlier part of the range, then re-tests the best runs (10% for the full search, 25% for the genetic algorithm) on the forward part, showing both result sets side by side. A parameter set that ranks well in both is a candidate; one that ranks well only in sample is curve-fit.
Can I run the same test on Quant Charts?
Yes. Describe the indicator and the trading rule to Quant, which writes the strategy in Pine Script; inspect the Code, set commission and slippage in the strategy properties and click Run to read the Backtest Summary. Re-run on other symbols and timeframes from the viewer as an out-of-sample check. MetaTrader remains a separate platform, and the LuxAlgo platform does not place orders for you.
References
LuxAlgo Resources
- Quant Charts
- LuxAlgo Quant
- Making Strategies with Quant
- Native Backtest Guide
- PineTS Documentation
- Relative Strength Index Indicator
- MQL Programming: Trading Code Essentials
- How to Write Pine Script for Trading Indicators
- Walk-Forward Testing vs Backtesting
- Backtesting Limitations: Slippage and Liquidity Explained
External Resources
Read next