Market Makers 101: Liquidity & Influence

Market makers quote prices at which they are willing to buy and sell, providing counterparties for other traders. Their activity can improve liquidity and price discovery, but it does not guarantee tight spreads, stable prices or an immediate fill of any size. Quoting obligations depend on the venue, instrument and role.
Understanding their economics helps you interpret spreads and execution conditions without assuming every price reversal reveals a market maker’s plan. Start with the difference between resting quotes, executed trades and the inventory risk a liquidity provider takes.
What Is a Market Maker?
A market maker deals for its own account when providing a buying or selling price. An agency broker, by contrast, acts for a client when executing an order. One firm can perform different functions in different parts of its business, so labels such as retail, institutional and wholesale are not necessarily mutually exclusive categories.
| Role | Typical activity | Important distinction |
|---|---|---|
| Exchange market maker | Quotes under an exchange’s market-making program | Obligations vary by program and instrument |
| Wholesale market maker | Handles order flow received from brokers, including retail flow | This is a business model, not proof of zero inventory or risk |
| Institutional liquidity provider | Quotes to institutions, including for larger transactions | May hedge or manage inventory across related products |
| Agency broker | Executes orders for clients | An agency execution is different from taking the other side as principal |
For a specific exchange example, NYSE describes its Designated Market Makers as having obligations to maintain fair and orderly markets in assigned securities. They facilitate price discovery around opens, closes and trading imbalances. NYSE also distinguishes proprietary supplemental liquidity providers from floor brokers acting as agents.
These duties do not mean a DMM chooses any opening price it likes. Auctions bring together eligible orders under the exchange’s rules. Nor does the NYSE model describe every stock exchange, bond market, futures venue or crypto platform.
Market-Maker Video Introduction
The retained Citadel Securities video was published February 10, 2023. It introduces market making from a market-making firm’s perspective. Treat its description of benefits as an overview, alongside the execution risks and venue-specific limits discussed below.
How Spread Revenue Works
The bid is the buying quote and the ask is the selling quote. Suppose a market maker buys 1,000 shares at $9.50 and later sells the same quantity at $9.60. The gross difference is $100: 1,000 × $0.10. That is not necessarily net profit after fees, financing, hedging costs and losses on other inventory.
The two executions are not guaranteed to occur as a matched pair. If the market maker buys at $9.50 and can later sell only at $9.30, the price difference is a $200 loss on 1,000 shares before costs. A quoted spread compensates for risks and operating costs; it is not a risk-free entitlement.
As another hypothetical quote, a stock near $175 might show a $174.95 bid and $175.05 ask. The spread is $0.10, but the available size and subsequent quote changes matter. A trader cannot assume an entire order will execute at the displayed best price.

Inventory, Adverse Selection and Hedging
Inventory risk arises when a market maker accumulates a position whose value can move before it is offset. Adverse selection occurs when the trades it receives tend to precede unfavorable price changes—for example, selling just before the market price rises. Firms adjust quotes, sizes and hedges to manage these exposures.
Consider the original hedge example: 10,000 shares bought at $50 and puts with a $48 strike costing $2 per share. Under a standard 100-share option multiplier, covering 10,000 shares requires 100 contracts and costs $20,000 in premium, before fees.
At expiration, if the stock is below $48, the stock-plus-put payoff is $48 per share. Relative to the $52 combined purchase cost, the loss is $4 per share, or $40,000, under the stated assumptions. The put protects the payoff below its strike, but it has a cost and does not prevent all losses.
This protective-put position is not automatically delta-neutral. Delta measures sensitivity to an underlying price change; a put’s delta varies with market conditions and time. A delta hedge requires a calculated offset and can need rebalancing. It does not eliminate every other source of risk.
Inventory-aware models, including the Avellaneda–Stoikov approach, provide a framework for thinking about quote placement under specified assumptions. A model’s mathematical optimum is not a promise of optimal live execution when fills, fees, competitors and market dynamics differ from those assumptions.
Algorithms Do Not Eliminate Liquidity Risk
Automated systems can update quotes, check limits and manage orders rapidly. Their effect depends on the strategy, the feed, the venue and the surrounding market. There is no supported universal rule that using algorithms increases depth by 500% or dramatically reduces volatility.
Risk controls may reduce quoted size, widen prices or withdraw orders when thresholds are reached, subject to applicable obligations. These controls can protect an individual firm while available liquidity for other participants deteriorates. Technology failures and many firms responding to the same stress can also matter.
Measure Liquidity with the Right Data
Liquidity concerns the ability to trade a meaningful size at an acceptable cost. Activity and liquidity are related, but a large daily volume total does not tell you how much is available at the current best price. A high-volume session can still have wide spreads and poor execution during a volatile interval.
| Measure | What it tells you | What it does not establish |
|---|---|---|
| Quoted spread | Difference between the best bid and ask within the stated feed | The cost of filling an order larger than the available size |
| Displayed depth | Resting quoted size at price levels within feed coverage | That orders will remain or that all liquidity is visible |
| Trading volume | Shares or contracts traded over a period | The number of transactions or current resting size |
| Trade count | Number of reported executions under the feed’s convention | Total shares or contracts traded |
| Open interest | Outstanding derivative contracts | Current executable depth or the identity of a participant |
Compare the instrument, session, venue coverage and order size rather than assuming all exchange-listed stocks or bonds share one liquidity profile. Historical volume rankings for Ford, Amazon or Intel, and a change in one futures market, cannot demonstrate a universal market-making effect.
| Condition | Possible quoting response | Execution implication |
|---|---|---|
| Active, competitive trading | Narrower quotes and more available size | Potentially lower costs, with size and fill limits still relevant |
| High uncertainty or volatility | Wider quotes, smaller size or faster quote changes | Costs and slippage can increase |
| Low activity | Less size and fewer competing quotes | An order may move through several levels |
| Severe stress or a trading interruption | Liquidity may fall sharply or trading may pause | Do not assume continuous execution is available |
Market makers can support trading during difficult conditions, but they cannot guarantee that a market will remain liquid. The 2008 crisis should not be presented as proof that market makers prevented markets from freezing or that wider spreads keep a trader’s costs controlled.
What Price Patterns Can—and Cannot—Reveal
A volume spike, wick rejection, inside bar or reversal near a prior high can motivate a trading hypothesis. It does not identify the participant behind the trades, reveal a dealer’s inventory or prove deliberate stop targeting. Multiple forms of activity can produce similar candles.
For a hypothetical example, a price briefly trades below a prior low and closes back above it on increased volume. You can define that observable sequence and test what followed. Calling it evidence of one firm’s “liquidity grab” adds a claim that the chart alone cannot support. A named gold event and price should not be treated as evidence without a verified date and feed.
Keep order-book depth separate from time and sales: the former displays resting interest, while the latter reports executions. Hidden or reserve order types disclose less displayed size where supported, but they do not guarantee protection from adverse execution. Direct market access changes routing control; it does not establish that other traders cannot infer activity or that an order will get a better fill.
Use LuxAlgo for Observable Chart and Volume Research
LuxAlgo’s native order-flow tools use aggregated one-minute footprints containing executed volume at price and per-side activity. They do not provide a live order book or raw trade tape. That boundary is essential when researching market-making concepts.
The native footprint displays can help examine where executed activity occurred and how price responded. A large cell or imbalance does not identify a market maker, its intent or its unfilled orders.
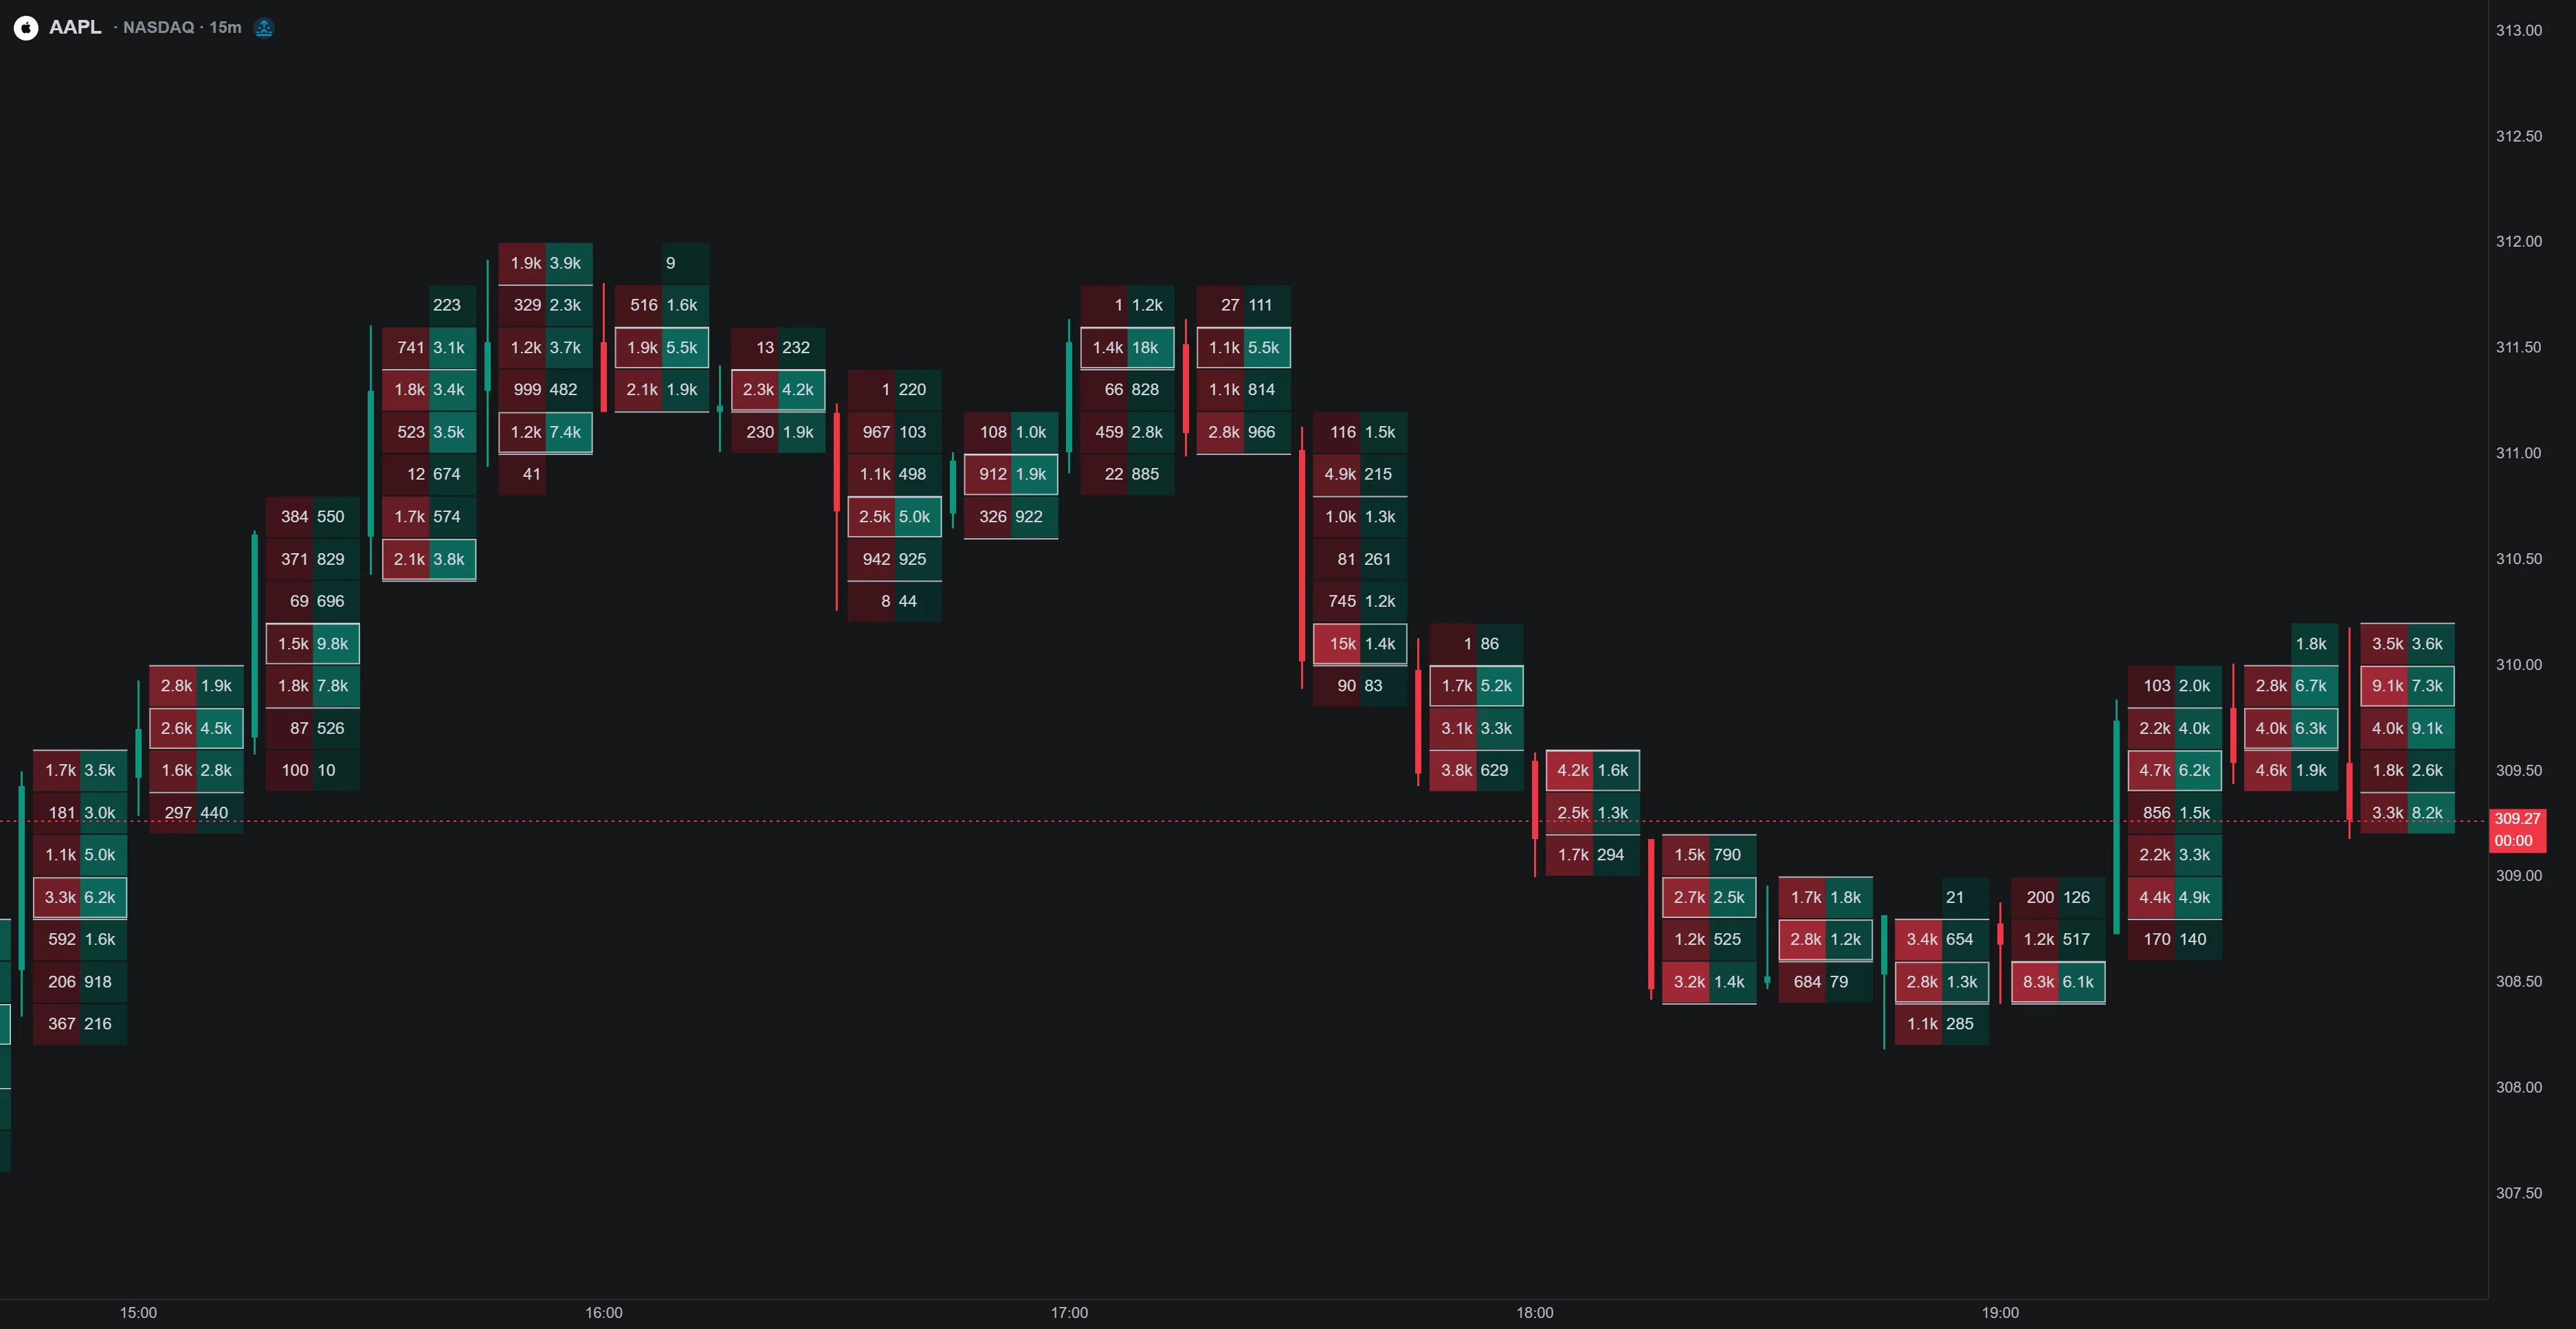
Check the supported data coverage before comparing observations. The documented native US-equity source is Cboe EDGX rather than a consolidated all-venue feed. Footprint-dependent tools cover supported crypto and US-equity markets; candle coverage does not imply the same order-flow coverage for every asset.
Ask Quant, our coding agent to help express a supported chart-strategy hypothesis. Inspect the generated code and run it manually, then review settings, costs and individual trades. Ordinary candle tests cannot reconstruct historical queue priority, changing quotes or the true fills of a market-making strategy.
The workspace demonstration below shows how to organize related chart experiments. Keep data-source coverage and execution assumptions with each test so a promising result can be interpreted in context.
Rules Depend on the Role and Jurisdiction
A market-making business must determine which registration, capital, reporting, conduct and venue obligations apply to its actual activities. An exchange designation and a broad business label are not interchangeable. NYSE’s DMM and supplemental-provider programs illustrate why quoting requirements should be checked at the program level.
In the European Union, MiFID II Article 17 as presented by ESMA requires relevant algorithmic investment firms to maintain systems and risk controls. Firms pursuing the specified market-making strategy have obligations including a binding venue agreement and regular quoting for a specified portion of trading hours, with exceptional-circumstance provisions. This is more specific than a blanket duty for every firm to quote at all times.
The original article’s May 2025 compliance instruction for the SEC’s 2024 dealer-definition expansion is outdated. AIMA, a party to the challenge, reported on November 21, 2024 that the district court vacated that final rule in full. This historical correction does not mean existing dealer obligations disappear; firms must assess the law and current rule status applicable to them.
Market-structure proposals, adopted rules and compliance dates are different stages. Verify the current regulator and venue material before acting on claims about tick sizes, order competition or registration. A technology trend or an old deadline is not a compliance checklist.
A Practical Execution Checklist
- Identify whether the data shows quotes, executed trades, aggregated footprints or candle-derived levels.
- Check the spread and available size against the planned order, including feed coverage and session.
- Choose the order type according to acceptable price and urgency; a limit can remain unfilled and a market order does not guarantee price.
- Record actual fills and costs rather than assuming the displayed spread was captured.
- Test observable setups across a dated sample, without labeling every reversal as intentional dealer activity.
Understanding market makers is most useful when it improves the questions you ask about liquidity and execution. It cannot turn incomplete chart data into knowledge of another participant’s strategy.
Frequently Asked Questions
Do market makers always earn the bid-ask spread?
No. Buying and selling at favorable prices is not guaranteed. Inventory moves, adverse selection, hedging and operating costs can outweigh the gross spread earned.
Does high trading volume mean deep liquidity?
Not necessarily. Volume measures past activity; depth concerns available quoted size at a given time. A high-volume market can still have wide spreads or little size near the best quote.
Can a wick or volume spike identify a market maker?
No. These observations can support a testable price-pattern hypothesis, but they do not reveal participant identity, inventory or intent.
Is Vela footprint a live order book?
No. It summarizes aggregated executed volume and per-side activity. It does not show live resting orders or a raw trade tape.
Does a protective put make a stock position delta-neutral?
Not automatically. It changes the payoff and adds a premium cost, while delta neutrality requires a calculated sensitivity offset that can change over time.
Read next