Share Buybacks: Impact on Stock Value
A share buyback, or share repurchase, is a company using its own cash to buy its stock back from shareholders and retire it or hold it in treasury. Fewer shares remain outstanding, so each remaining share represents a larger slice of the same business. That mechanical fact drives most of what investors argue about: buybacks lift earnings per share without changing earnings, they compete with dividends and reinvestment for the same cash, and they operate under specific SEC and tax rules. This guide explains how repurchases work, how they move per-share metrics, how they compare with dividends, what Rule 10b-18 and the 1% excise tax require, and how to read a buyback on the chart in Quant Charts.
What a Share Buyback Is
When a company repurchases shares, cash leaves the balance sheet and the share count falls. The remaining shareholders own proportionally more of the company, and the company's equity (book value) shrinks by the cash paid. Three execution methods are common:
| Method | How it works | What governs it |
|---|---|---|
| Open-market repurchase | The company buys shares through a broker over weeks or months, like any other buyer | SEC Rule 10b-18 safe harbor conditions; quarterly disclosure under Item 703 of Regulation S-K |
| Issuer tender offer | The company offers to buy a set number of shares from all holders at a fixed price, usually a premium, for a limited period; each holder decides whether to tender | SEC tender offer rules |
| Accelerated share repurchase | The company pays a bank up front and receives most of the shares immediately; the bank buys in the market over time to cover | Contract terms with the bank; the same disclosure obligations |
Whichever route is used, the SEC requires reporting issuers to disclose their repurchase activity in periodic filings, so the actual pace of buying, as opposed to the announced authorization, is a matter of record.
How Buybacks Change Per-Share Metrics
The clearest effect is on earnings per share. EPS is net income divided by shares outstanding, so cutting the denominator raises the ratio even when the business earns exactly the same amount. The worked example below holds net income fixed and retires 10% of the shares.
| Metric | Before buyback | After 10% buyback |
|---|---|---|
| Net income | $1,500,000 | $1,500,000 |
| Shares outstanding | 3,000,000 | 2,700,000 |
| Earnings per share | $0.50 | $0.56 |
| Price-to-earnings ratio at a $10 share price | 20.0 | 18.0 |
Three consequences follow. First, EPS growth from buybacks is not the same as profit growth; a company can report rising EPS on flat or falling net income. Second, at an unchanged share price the P/E ratio falls, which can make the stock look cheaper without any change in the business. Third, because the cash spent leaves shareholders' equity, return on equity rises mechanically, and a company that repurchases aggressively for years can end up with very little book equity or even negative equity, at which point ROE stops meaning anything. Comparing net income, free cash flow and revenue trends alongside EPS separates operating growth from share-count arithmetic.
Buybacks vs Dividends
The SEC defines a dividend as a portion of a company's profit paid to shareholders, usually on a fixed schedule, with unscheduled payments called special dividends. A buyback distributes cash differently: only the shareholders who sell receive it, and those who hold receive a larger ownership stake instead.
| Feature | Buyback | Dividend |
|---|---|---|
| Who receives cash | Shareholders who sell | All shareholders |
| Effect on share count | Falls | Unchanged |
| Effect on EPS | Rises mechanically | None |
| Commitment | An authorization the company may use, pause or leave unfilled | A schedule investors expect to continue |
| Shareholder tax timing | Generally when shares are sold | When the dividend is paid |
| Company-level tax | 1% excise tax on the fair market value repurchased (see below) | None |
Neither is automatically better for the shareholder. A dividend converts part of the holding to cash whether or not the holder wants to sell; a buyback lets each holder choose, but its value depends on the price the company pays. Repurchasing shares above their worth transfers value from remaining holders to sellers; repurchasing below it does the opposite.
The Rules: Rule 10b-18 and the 1% Excise Tax
SEC Rule 10b-18 gives an issuer a safe harbor from manipulation liability under the Exchange Act solely by reason of the manner, timing, price and volume of its open-market repurchases, provided all four conditions are met each day. Compliance is voluntary, but failing any one condition removes the safe harbor for that day's purchases, and the safe harbor is never available for a scheme to evade the securities laws.
| Condition | Requirement under Rule 10b-18 |
|---|---|
| Manner | Purchases through only one broker or dealer on any single day |
| Timing | Not the opening purchase, and not in the last 10 minutes of the primary session for securities with average daily trading volume of at least $1 million and public float of at least $150 million, or the last 30 minutes for all other securities |
| Price | No higher than the highest independent bid or the last independent transaction price, whichever is higher |
| Volume | No more than 25% of the security's four-week average daily trading volume per day, with one block purchase per week permitted instead of that day's 25% limit |
Tax adds a second layer. The Inflation Reduction Act of 2022 created a stock repurchase excise tax under section 4501 of the tax code equal to 1% of the fair market value of stock repurchased during the tax year by covered corporations, meaning domestic corporations whose stock trades on an established securities market, effective for repurchases after 2022. Companies compute it on IRS Form 7208, attached to Form 720, and the form's instructions apply a $1 million threshold below which the detailed computation is not required. The tax is paid by the company, so it reduces the cash available for buybacks rather than appearing on a shareholder's return.
What a Buyback Does and Does Not Tell You
- An authorization is not a purchase. Boards announce a maximum they may spend, often over years. The disclosed repurchase activity in periodic filings shows what was actually bought and at what average price.
- Funding matters. Repurchases paid from surplus operating cash leave the balance sheet intact. Repurchases funded with borrowing raise leverage; the EPS gain is then partly a financing decision, and interest costs recur.
- Offsetting dilution is not shrinking the float. Many programs exist to absorb shares issued through employee stock compensation. If the share count is flat year over year, the buyback is maintaining the count, not reducing it.
- Price paid decides the value. A repurchase is an investment in the company's own stock, and the same valuation questions apply. Management teams tend to buy more when cash is plentiful, which is often when prices are high.
- Opportunity cost. Cash returned cannot also fund research, capacity or acquisitions. Whether that is a discipline or a missed investment depends on the returns available inside the business.
Where Quant Charts Fits
LuxAlgo does not read SEC filings for you and does not place orders. What Quant Charts adds is the market-data side of buyback analysis: the per-share fundamentals beside the price, a view of where the holder base's average cost sits as the share count changes, and a way to test how the stock actually behaves around repurchase news.
Check the per-share fundamentals beside the chart. The Watchlist Advanced Financials tab lists revenue, net income, EPS, P/E, dividend per share, yield and beta for stocks, with year-over-year growth where it exists. Rising EPS next to flat net income is the buyback signature described above, visible without opening a filing. The News tab collects headlines for the listed symbols, which is where authorization announcements and quarterly disclosures surface.
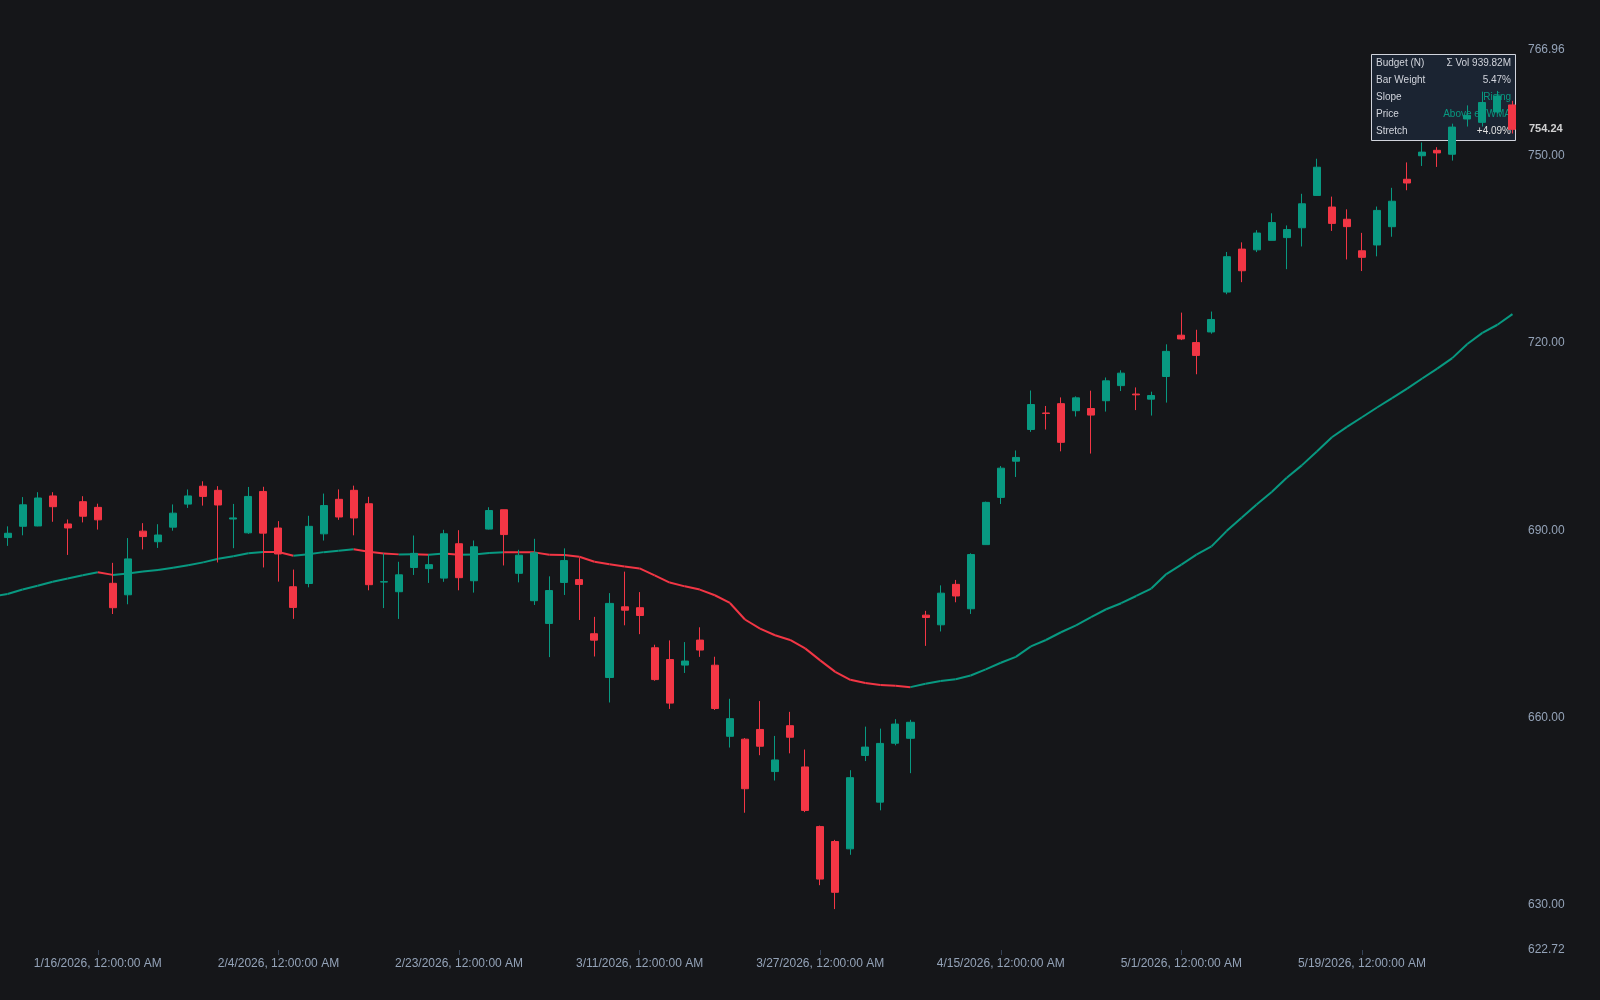
Read the holder base's cost basis. The Elastic Volume-weighted MA indicator lets volume rather than time decide how fast its average moves, and its Shares Outstanding (Float) budget mode turns the line into an approximate average entry price for the holder base. A shrinking float from repurchases is exactly the input that mode is built around, and a stretch far above or below the line flags large open profits or losses among holders, context for how they may react to news.
Anchor to the announcement. An anchored VWAP started on the announcement bar tracks the average price paid since the news, and relative volume shows whether the announcement drew unusual participation or passed unnoticed. Because Rule 10b-18 caps a company's own daily buying at a quarter of average volume, the repurchase itself is rarely the dominant flow on any given day; the reaction of other participants is what the chart records.
Test the pattern with Quant. Describe a rule to Quant, our coding agent, in plain language, for example a long entry when price pulls back to the volume-weighted average anchored at a buyback announcement and closes back above it, with a stop under the pullback low. Quant writes the Pine Script; open Code to inspect it, then click Run. The Backtest Summary reports net profit, trade count, win rate, max drawdown and profit factor, with commission and slippage set in the strategy's Properties. Announcement-driven rules produce few trades per symbol, so re-run the same rule across several repurchasing companies in the backtest viewer before drawing conclusions, and record any live trades in the Journal with the announcement date noted.
The video below shows how favorite indicators are saved and applied in Quant Charts.
Where Each Tool Stops
- SEC filings hold the authorization, the actual repurchase activity and average prices, the share count and the financial statements. They are the only source for whether a program was funded from cash or debt.
- Quant Charts shows per-share fundamentals in the Financials tab, headlines in the News tab, volume-weighted cost references and relative volume on the chart, and backtests rules through Quant. It does not parse filings or place orders.
- The Library explains the anchored volume-weighted average price, relative volume and the elastic volume-weighted moving average, and provides the indicators that implement them.
- The Journal stores your own trades and computes P&L, drawdown and an Edge Score from them.
Conclusion
A buyback shrinks the share count and the equity base, so EPS rises and ROE rises whether or not the business improved. Its value to a remaining holder depends on the price paid relative to what the shares are worth, on whether the cash came from operations or borrowing, and on whether the count is really falling or merely holding steady against stock compensation. Rule 10b-18 constrains how a company may buy in the open market, quarterly filings record what it actually bought, and since 2023 a 1% excise tax applies at the company level. Quant Charts adds the market view: per-share fundamentals beside the price, a float-weighted cost basis for the holder base, event-anchored levels and tested rules. The filings still carry the investment case.
Key Takeaways
- A repurchase reduces shares outstanding and shareholders' equity; EPS and ROE rise mechanically even with unchanged net income.
- Open-market buybacks, issuer tender offers and accelerated share repurchases are the main methods; actual activity is disclosed in periodic filings.
- Dividends pay every holder on a schedule; buybacks pay sellers and raise the stake of holders, with tax generally deferred until sale.
- Rule 10b-18's safe harbor requires one broker per day, timing limits, a price cap at the highest independent bid or last trade, and a 25% of average-volume daily cap.
- The Inflation Reduction Act's 1% excise tax on repurchases applies to covered corporations for repurchases after 2022, computed on Form 7208.
- Quant Charts shows EPS and P/E in the Financials tab, approximates holder cost basis with the float-budget Elastic Volume-weighted MA, anchors volume-weighted averages to announcements and backtests rules through Quant.
FAQs
What is a share buyback?
A company purchasing its own shares from shareholders, through the open market, a tender offer or an accelerated repurchase agreement. The shares are retired or held in treasury, so fewer shares remain outstanding and each remaining share represents a larger fraction of the company.
Why does a buyback raise earnings per share?
EPS is net income divided by shares outstanding. Retiring shares shrinks the denominator, so EPS rises even if net income is unchanged. In the article's example, retiring 10% of 3,000,000 shares lifts EPS from $0.50 to about $0.56 on the same $1,500,000 of net income.
Are buybacks better than dividends?
Neither is automatically better. Dividends pay all holders on a schedule and are taxed when received. Buybacks pay only sellers, raise the ownership stake of holders, and defer shareholder tax until sale, but they create value for holders only when the company pays less than the shares are worth.
What is Rule 10b-18?
An SEC safe harbor that protects an issuer from manipulation liability for open-market repurchases if, each day, it uses one broker, avoids the opening trade and the final minutes of the session, pays no more than the highest independent bid or last independent trade, and buys no more than 25% of the stock's four-week average daily volume, with one block purchase per week allowed instead.
What is the 1% buyback tax?
A federal excise tax created by the Inflation Reduction Act of 2022 equal to 1% of the fair market value of stock repurchased in a tax year by covered corporations, effective for repurchases after 2022. The company pays it and reports it on IRS Form 7208 with Form 720.
How can Quant Charts help analyse a buyback?
The Watchlist Advanced Financials tab shows EPS, P/E, net income and dividends beside the chart, the Elastic Volume-weighted MA in float mode approximates the holder base's average cost as the share count changes, the anchored volume-weighted average and relative volume frame the announcement, and Quant backtests rules around such events. Quant Charts does not read filings or place orders.
References
LuxAlgo Resources
- Elastic Volume-weighted MA indicator (LuxAlgo Library)
- Anchored VWAP and Relative Volume (LuxAlgo Library)
- Watchlist Advanced: Price, Financials and News (LuxAlgo Docs)
- Making strategies with Quant and Reading a strategy backtest (LuxAlgo Docs)
- Quant Charts Journal (LuxAlgo Docs)
External Resources
- 17 CFR 240.10b-18: Purchases of Certain Equity Securities by the Issuer and Others (Cornell LII)
- IRS: Treasury and IRS Issue Guidance on the Corporate Stock Repurchase Excise Tax (Notice 2023-2)
- IRS: Instructions for Form 7208, Excise Tax on Repurchase of Corporate Stock
- SEC Investor.gov Glossary: Dividend
- SEC Investor.gov Glossary: Tender Offer
Read next