Concept
Relative Volume
Relative Volume, also known as volume MA baseline, is a Volume & Order Flow concept. The Library holds 5 implementations, each one a working definition you can pull into Quant.
RVOL
Top Relative Volume indicators
The top custom implementations, built on the original standard Relative Volume formula.
5 total
From studying Relative Volume to trading it: take any implementation below into Quant and backtest it instantly.
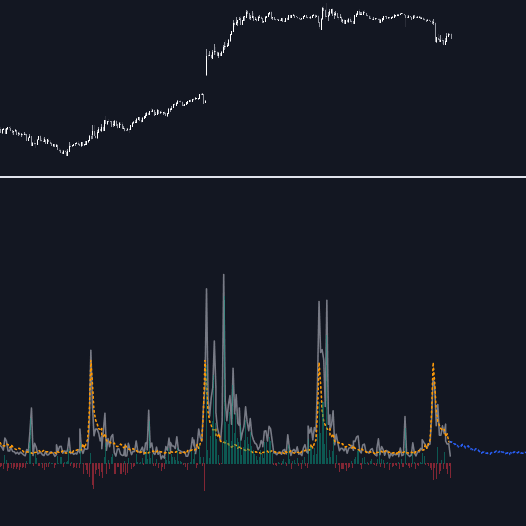
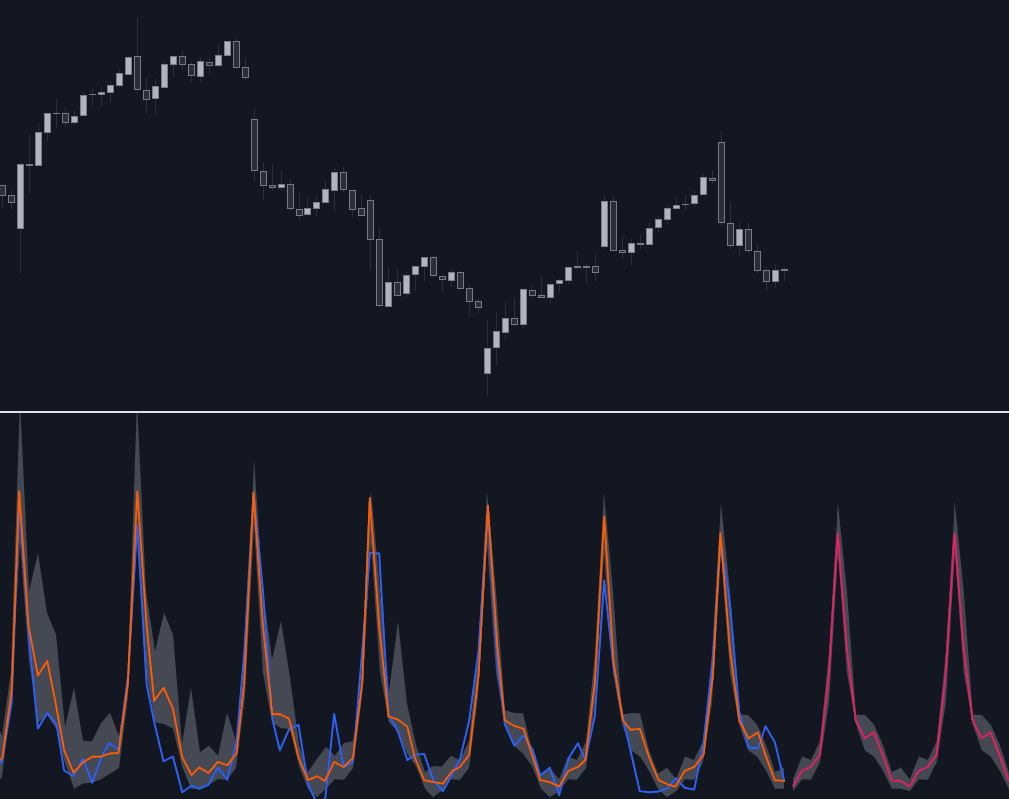
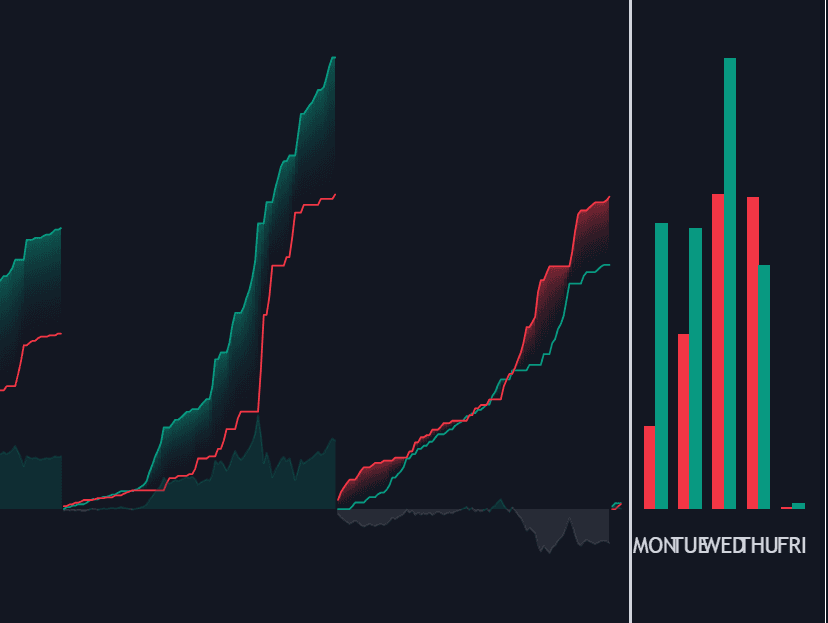
What is Relative Volume?
Relative volume (RVOL) expresses current volume as a multiple of what is normal for that symbol at that time. The simplest form divides the latest bar's or day's volume by an average baseline, such as the mean of the prior 20 sessions: a reading of 1 is ordinary, 3 means three times usual participation. Because it is a ratio, RVOL is comparable across symbols whose raw volumes differ by orders of magnitude.
Intraday, the honest version adjusts for time of day. Volume follows a U-shaped curve, heavy at the open and close and thin through lunch, so comparing a mid-morning bar against a flat all-day average misleads. Proper intraday RVOL compares cumulative volume up to this minute against the average cumulative volume at the same minute over prior sessions, a correction covered under time-of-day effects.
RVOL matters because volume only means something against its own baseline. Ten million shares is a quiet day in one name and a historic session in another. Normalizing lets scanners rank an entire watchlist by unusual participation, which is how day traders find 'in play' symbols, and it grades how much of a crowd is behind a move. What it does not do is give direction: high RVOL signals attention, not intent.
How to calculate Relative Volume
RVOL is a ratio; the design decision is what baseline sits in the denominator.
- 1Pick a baseline. On daily charts, an average of the prior N sessions' volume (a plain volume moving average) is the standard choice; the lookback defines what 'normal' means.
- 2Divide current volume by that baseline: RVOL = current volume / average volume, so 1.0 is normal by construction and 2.0 is double the usual participation.
- 3For intraday use, swap in a time-of-day baseline: compare today's cumulative volume at this time against the average cumulative volume at the same time across prior sessions, so the open's natural surge does not register as a signal every morning.
- 4Read the ratio against your own cutoffs. There is no universal threshold; what counts as elevated depends on the symbol, the session, and what the reading is being used to do.
How it's calculated
Current volume expressed as a multiple of its normal level, where 1.0 is average and 2.0 is twice average.
Many implementations include the developing bar in its own moving-average baseline (i = 0 to n - 1), which dilutes the reading; line 2 excludes it.
Intraday, prefer the time-of-day or cumulative forms, since volume follows a U-shaped session curve that a flat average misreads at the open and midday.
A developing bar's RVOL rises as the bar fills and is only final at the close.
How traders use it
- For screening: ranking a universe by RVOL surfaces the symbols where something unusual is happening today, and premarket RVOL is a staple of gap-and-go scans. A volume spike is the single-bar version of the same anomaly.
- For breakout validation: a breakout attempted on elevated RVOL has, by definition, more participation behind it than one on quiet tape, which is why many systems require volume at the breakout to exceed some multiple of baseline.
- For regime context: persistently sub-1 readings mark volume dry-up, the quiet contraction that consolidation-based setups deliberately look for, while rising RVOL inside a base warns that resolution may be approaching.
- For event handling: earnings and macro event days produce sessions of elevated RVOL, so some strategies stand down (mean reversion behaves differently in abnormal tape) while others activate only when RVOL confirms a crowd has arrived.
Relative Volume vs neighboring volume measures
Volume Spike: A spike is a discrete event: one bar far above baseline. RVOL is the continuous measuring stick that defines the spike in the first place, and it also captures milder, sustained elevation that a single-bar test misses.
Volume Dry-up: Dry-up is the opposite tail: participation shrinking well below baseline, often inside consolidations. It is a state RVOL detects (readings persistently under 1) rather than a different calculation.
Volume Oscillator: The volume oscillator measures the spread between a fast and a slow volume average, so it tracks whether volume is accelerating or fading. RVOL compares volume to a baseline level; the oscillator compares two smoothed versions of volume to each other.
Z-score: A volume z-score subtracts the mean and divides by standard deviation, so it accounts for how variable a symbol's volume normally is. RVOL's plain ratio is easier to read but treats a jumpy symbol and a steady one identically at the same multiple.
More Relative Volume implementations
Concept family
Volume & Order Flow
88 concepts mapped · 88 in the Library
Relative Volume FAQ
Turn Relative Volume into a trading strategy.
Take any implementation from this page into Quant, then build on it, backtest it on real data, and keep refining it in conversation.