Top 7 News Filtering Tools for Traders
A news filtering tool does one job: it turns the firehose of headlines, filings, releases and posts into the handful of items that matter for the symbols and the timeframe you actually trade, and it delivers them fast enough to act on. The market for these tools ranges from audio squawk services built for professional desks to free feeds aimed at retail day traders, and most vendor pages compete on adjectives. This guide takes a different approach. It sets out what actually needs filtering and where the primary sources are, the features that separate a useful tool from a noisy one, plain descriptions of seven widely used tools drawn from what the vendors themselves say, a workflow for using any of them, and how to read the price reaction once the news is in, which is where Quant Charts comes in: it has no news feed of its own, and it is where the filtered event meets the chart, with Quant, our coding agent, writing the rules that avoid or exploit it.
Key points:
- Filter by relevance first, speed second. A feed restricted to your watchlist and your event types beats a fast feed you cannot read.
- Scheduled news is a calendar problem. Macro releases and earnings have known times; the tool's job is the unscheduled remainder.
- You will not beat the machines to a headline. Institutional systems react in microseconds; retail news tools are for context and discipline, not for racing.
- Confirm from the primary source. Filings, central-bank statements and statistical releases are public; a tool that links to them is worth more than one that paraphrases.
What Needs Filtering
| News type | Scheduled? | Primary source | Filtering need |
|---|---|---|---|
| Macro releases (payrolls, inflation, GDP) | Yes, to the minute | Statistical agencies; the Bureau of Economic Analysis publishes its release schedule | A calendar with impact tiers, not a feed |
| Central-bank decisions and speeches | Yes | The Federal Reserve's public calendar and statements | Calendar plus fast text of the statement |
| Earnings and guidance | Yes, by date; time of day varies | Company releases and filings | Watchlist-scoped alerts; awareness of earnings-season phases |
| Regulatory filings | No | EDGAR, the SEC's filing system, which is public and searchable | Ticker and form-type filters (8-K, 13D, insider forms) |
| Corporate actions and breaking headlines | No | Newswires, exchanges, the company | Ticker tagging, keyword filters, deduplication |
| Social and attention data | No | Platforms and aggregators | Normalisation and decay; attention is not direction |
Two facts shape the whole exercise. Regulation Fair Disclosure requires US public companies to release material information to everyone at once, so the primary source of company news is the company's own filing or release, and every tool is a relay of it. And scheduled events are the majority of what moves markets on a given day; the Library's quarterly earnings season phases and the macro calendar are known weeks ahead, which means a good part of "news filtering" is calendar discipline rather than software.
Features That Matter
| Feature | Why it matters | What to check |
|---|---|---|
| Watchlist scoping | Removes most of the noise before any other filter | Can alerts be restricted to your symbols and sectors, and synced with your charting watchlist? |
| Source coverage and links | Paraphrase introduces error; the filing or statement is the fact | Does each item link to the primary source and name the wire it came from? |
| Latency | Seconds matter for intraday traders; minutes are fine for swing traders | Measured delay from release to alert, and whether the free tier is delayed |
| Keyword, exclusion and form filters | Lets you keep guidance changes and drop promotional releases | Boolean filters, negative keywords, filing-type selection |
| Sentiment and summaries | Useful triage; the Library's alternative sentiment data entry explains why attention and tone must be separated | Whether scores are explained and whether you can see the underlying text |
| Delivery | Audio for hands-free desks, pop-ups for screen traders, mobile for swing traders | Channels offered and whether they work with the platform closed |
| Calendar integration | Scheduled events need countdowns and impact tiers | Economic and earnings calendars inside the tool |
| Total cost | Subscriptions, data fees and the broker account some tools require | Current pricing on the vendor's site; it changes and is not repeated here |
Seven Tools, Described Plainly
The descriptions below are drawn from what each vendor says about itself and from our own reviews where we have written one. Pricing, latency figures and source counts change frequently and are deliberately omitted; check the vendor's current page before paying.
| Tool | What it is | Best fit |
|---|---|---|
| Newsquawk | A real-time financial news platform combining human analysts with curated algorithms, known for its live audio squawk, headline feed and economic calendar across macro, FX, bonds, commodities and equities | Multi-asset and macro traders who want hands-free delivery |
| Benzinga Pro | A news terminal for active traders with a fast newswire, watchlist alerts, an audio squawk and calendars; see our full review | US equity day and swing traders |
| Trade Ideas | A real-time AI stock-scanning and charting platform with alerts, entry and exit signals and backtesting; news and social sentiment feed its scanners | Scan-driven equity traders who want news inside the scanner |
| Scanz | A real-time stock scanner for active day traders that pairs news alerts with technical scan triggers | Momentum traders combining headlines with price and volume triggers |
| Stock Titan | A stock-specific news feed and screener with filters by ticker and company attributes | Retail stock traders who want ticker-scoped press-release alerts |
| Trading Central | Expert-built, AI-powered research and analytics distributed through brokerage platforms since 1999, including pattern recognition and market commentary | Traders whose broker already includes it |
| Lightspeed | An active-trading brokerage platform for stocks, options and futures whose scanning tools include news and filings for account holders | High-volume traders who want news inside their execution platform |
Three of the seven, Trading Central, Lightspeed and, for some brokers, Benzinga content, reach traders through a brokerage platform rather than a direct subscription, so the practical question is often which broker you use rather than which tool. For the alternative-data services that sit next to news, insider and political trading trackers, options flow and the like, see our reviews of QuiverQuant and Unusual Whales and our guide to alternative data.
A Filtering Workflow That Works With Any Tool
- Start from the watchlist, not the feed. Decide the symbols and sectors you trade, load them into the tool and into your charting watchlist, and restrict alerts to them. Everything else is background.
- Put the calendar first. Before the session, note the scheduled releases and earnings for your names and decide in advance whether you trade through them, stand aside or trade the reaction. Our guide to adapting to market events covers the decision, and earnings reports and stop-loss adjustments the risk side.
- Tier the unscheduled items. Filings and guidance changes for your names at the top; sector and macro headlines next; commentary and social attention last. Use exclusion keywords to drop promotional releases and duplicate wires.
- Confirm at the source before acting. Open the filing or the statement the alert points to. A summary that says "beat" and a filing that says "beat on revenue, cut guidance" are different trades.
- Read the price reaction, not the headline. The chart shows whether the market agrees with your reading, which is the subject of the next section.
- Log it. Record the event, your reading and the outcome, so you learn which categories of news you actually trade well.
Reading the Reaction on the Chart
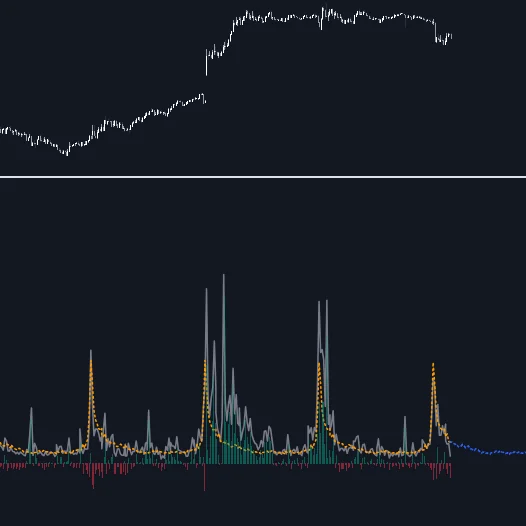
News is only tradable through what price and volume do with it, and two facts about that reaction should temper any news-trading plan. First, markets absorb public information quickly; the efficient-market view is imperfect, but the first move on a widely distributed headline is taken by systems that read it in microseconds, as our guide to high-frequency versus retail algorithmic trading explains. Second, attention decays fast: the Library's alternative sentiment entry notes that spikes in chatter coincide with short-lived moves, strongest in small volatile names, and that attention volume says nothing about direction. The retail edge, where there is one, is in the second phase: whether the move holds, whether participation confirms it, and whether the reaction fits the context of the session.
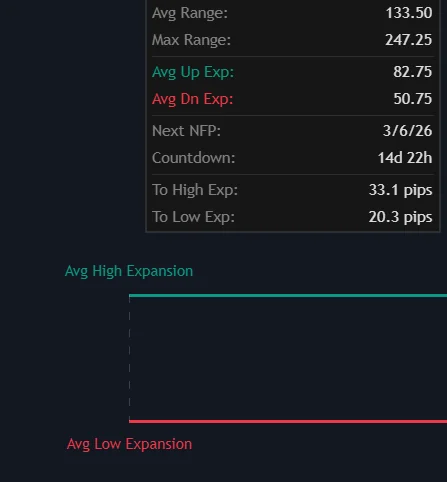
The Library provides the instruments for that read. Volume Surprise scores each bar's volume against the level history says is typical for that time of day and weekday, so a headline that draws real participation prints as a positive surprise and a muted reaction to a big story prints as a negative one, with time-of-day effects already accounted for. For scheduled macro events, NFP Price Zones measures how price expanded during past Non-Farm Payrolls releases and projects those statistics forward, freezing the levels thirty minutes before the print so risk can be placed against objective zones. The trading sessions entry frames when liquidity is present to absorb news at all.
Where Quant Charts Fits
Quant Charts does not carry a news feed. Its workspace panels today consist of the Watchlist, with more widgets planned, so the filtering itself happens in one of the tools above. What Quant Charts provides is the other half of the workflow: the same watchlist of names beside the chart with live quotes, the event-aware Library tools described above, and Quant to encode the rules you decided on before the session. Describe them, skip new entries in the thirty minutes around a scheduled release, require a positive volume surprise before taking a breakout after a headline, and exit if the move fails to hold its first bar's range, and Quant writes the rule in Pine Script on the active chart. Open Code to read the logic, click Run, and the Backtest Summary reports net profit, trade count, win rate, maximum drawdown and profit factor with commission and slippage set in the strategy properties, which is how to find out whether trading around news has actually paid before doing it with capital. The Making Strategies with Quant guide shows the workflow, and the Journal is the place for step six, logging each event trade with its reasoning against the painted fills.
One boundary. The LuxAlgo platform does not place orders for you; Quant Charts is where rules are written and tested, and execution stays with your broker.
Conclusion
The best news filtering tool is the one whose output you can act on: scoped to your watchlist, tiered by what matters, linked to primary sources and delivered in the channel you will notice. Scheduled news is a calendar problem you can solve before the session; unscheduled news is where the tools earn their fee, and the seven above cover the range from professional audio squawk to broker-bundled research. Whatever filters the feed, the trade is made on the chart, where Quant Charts shows the participation behind the reaction, Quant writes the event-aware rule, and the Backtest Summary reports whether it has been worth taking.
Key Takeaways
- Scope before speed. Watchlist filters remove more noise than any latency upgrade.
- Calendar first. Macro releases and earnings are scheduled; decide the plan before the print.
- Confirm at the source. Filings and statements are public; summaries are relays.
- Trade the reaction, not the headline. Volume Surprise and NFP Price Zones show whether the market agrees.
- Quant Charts has no news feed, and it is where the filtered event meets the chart: Quant writes the rule, the Backtest Summary judges it with costs, and no LuxAlgo tool places orders.
FAQs
What is a news filtering tool for traders?
Software that collects headlines, filings, releases and social posts, restricts them to the symbols, sectors and event types a trader cares about, and delivers alerts by pop-up, audio or mobile. Better tools link each item to its primary source, integrate an economic and earnings calendar, and let you exclude promotional or duplicate items.
Which news source is fastest for traders?
For public company news, the company's own filing or release is the origin and every service is a relay; for macro data, the statistical agency's release is the origin. Institutional systems read these in microseconds, so no retail tool wins the race to the first tick. Judge tools by scoping, source links and reliability rather than by a claimed number of seconds, and check any latency claim yourself on the free tier.
Do I need a paid news service to trade?
Not necessarily. The Federal Reserve calendar, the Bureau of Economic Analysis release schedule and EDGAR filings are free and primary. Paid services add speed, aggregation, ticker tagging, audio delivery and calendars in one place, which matters most for intraday traders. Swing and position traders can often work from the calendar and the primary sources alone.
Is news sentiment analysis reliable?
As triage, yes; as a signal, only with care. Sentiment tools measure attention (how much is being said) more reliably than valence (whether it is bullish or bearish), and attention spikes coincide with short-lived moves that are strongest in small volatile names and decay quickly. Normalise scores against each asset's own history and confirm with price and volume before acting.
How should I trade around scheduled news such as payrolls or earnings?
Decide before the event whether to stand aside, trade through with reduced size or trade the reaction. Tools such as NFP Price Zones project expansion levels from past releases and freeze them before the print, and Volume Surprise shows whether the reaction drew unusual participation. Test the plan as a rule with costs before committing capital.
Does Quant Charts include a news feed?
No. Quant Charts workspace panels currently consist of the Watchlist, with more widgets planned, so news filtering happens in a dedicated tool. Quant Charts supplies the watchlist beside the chart, event-aware Library indicators such as Volume Surprise and NFP Price Zones, and Quant, which writes time-filtered and volume-confirmed rules in Pine Script and reports them in the Backtest Summary. No LuxAlgo tool places orders.
References
LuxAlgo Resources
- Quant Charts
- LuxAlgo Quant
- Making Strategies with Quant
- Workspace Panels Documentation
- Watchlist Documentation
- Journal Documentation
- Volume Surprise Indicator
- NFP Price Zones Indicator
- Alternative Sentiment Data Concept
- Quarterly Earnings Season Phases Concept
- Intraday Time-of-Day Effects Concept
- Trading Sessions Concept
- Benzinga Pro Review: Is News Edge Worth the Cost?
- Adapting to Market Events: Why Flexibility Is Key for Traders
- Earnings Reports and Stop-Loss Adjustments
- Alternative Data for Algorithmic Trading: What Works?
- QuiverQuant Review: See Insider Trades and Alternative Data
- Unusual Whales Flow: Decode Option Whales Fast
- High-Frequency Trading vs. Retail Algorithmic Trading
External Resources
- Federal Reserve — Calendar of News Events
- Bureau of Economic Analysis — Release Schedule
- Wikipedia — EDGAR
- Wikipedia — Regulation Fair Disclosure
- Wikipedia — Economic Calendar
- Wikipedia — Event-Driven Investing
- Wikipedia — Efficient-Market Hypothesis
- Newsquawk
- Trade Ideas
- Scanz
- Stock Titan
- Trading Central
- Lightspeed
Read next