TradingSim: Simulation Analysis
TradingSim is a browser-based market replay simulator: it takes recorded tick data for US stocks, futures and crypto and plays a past trading session back, with charts, Level 2, time and sales, scanners and order entry all moving together, so you can trade the day as if it were live. This guide explains what the replay engine does and does not do, which markets and data each plan includes at current prices, how order entry and order-flow replay work, what the built-in analytics track, and how to use the whole thing deliberately rather than as a video game. It closes with where Quant Charts, LuxAlgo's charting and AI platform, fits: the research and costed backtest come before a simulator session, the Journal records what happened in it, and a different kind of simulation, LuxAlgo's prop-firm pass-rate simulator, answers a question replay cannot.
Key points:
- Replay is execution practice, not strategy research. It trains entries, exits and order handling against real historical ticks; it does not tell you whether a rule has an edge across years of data.
- Two plans, one difference that matters. Pro and Premium share the replay engine; Premium adds deeper history, tick and second charts, Level 2 and delayed live sessions.
- Analytics only pay off with a protocol. Win rate and P&L by setup mean something when the setups were defined before the session, not named afterwards.
- Simulate in the right order. Backtest the rule with costs, rehearse execution in replay, log the fills in a journal, and stress the account rules separately.
What TradingSim Is
TradingSim's about page describes a company built by two former consultancy analysts who met in 2001 and began trading full time in 2007, with a stated mission of letting traders learn from market hindsight without losing money. The product is a web application: no download, no brokerage account and no funding requirement, and the features page stresses that practice is available around the clock because the sessions are recorded rather than live. The site claims more than fifty thousand traders trained. What distinguishes it from a broker's paper-trading mode is the replay itself: a paper account at a broker only moves at the speed of the real market during market hours, while a replay engine lets you pick a date, start at the pre-market and run the session at whatever speed suits the exercise.
The Replay Engine
The engine is session-based, meaning one clock drives everything on screen. Change the replay time and every chart, every timeframe, the Level 2 book, the tape, the scanner and the watchlists move to the same moment, which is what makes multi-symbol practice honest: you cannot accidentally read tomorrow's print on one panel while trading today's on another. The table lists what the home page documents.
| Replay feature | What it does |
|---|---|
| Full-session replay | Replays a chosen trading day including pre-market and post-market, with symbols, Level 2, scanners and time and sales synchronised |
| Multi-symbol, multi-timeframe views | Several tickers on different timeframes at once, all synced to the replay clock |
| Speed controls | Slow the session to half speed or run it at two, five or ten times, with every chart and timeframe staying in step |
| Jump controls | Move to a specific time, step forward or back in small increments, or jump straight to the pre-market, the open or after hours |
| Bookmarks | Mark exact moments in a replay, such as a breakout or a pullback, categorise them by strategy or market condition, and jump back to them later |
| Workspaces | Drag-and-drop layouts of charts, Level 2, time and sales, watchlists and scanners, saved and switchable per strategy |
The speed controls are the feature to think about most carefully. Fast-forwarding through dead periods is efficient, but the pressure of a real session comes precisely from waiting through them, and a trader who only ever practises at five times speed learns to expect a setup every few minutes. Alternate: run some sessions at real time to practise patience and some at speed to accumulate repetitions.
Markets, Data and Plans
Coverage spans three asset classes. Equities run to more than ten thousand symbols across Nasdaq, NYSE and AMEX, from small caps to large caps, on tick-by-tick data. Futures include mini and micro contracts on indices, commodities, currencies and interest rates, with the S&P e-minis, Nasdaq 100, gold, crude oil and ten-year Treasury notes named as examples. Crypto covers the major coins. Pricing, from the day-trading page and the home page as of September 2026, is two annual plans, both with a seven-day free trial.
| Plan | Price | What it includes |
|---|---|---|
| Pro | $33 per month, billed annually at $396 | Web-based replay, workspaces, US equities, crypto and futures, two years of market history |
| Premium | $37 per month, billed annually at $449 | Everything in Pro plus five years of history, tick and second charts, Level 2 data, and live market sessions on a fifteen-minute delay |
For most traders the Premium features are the ones that matter, because Level 2 and tick charts are exactly the tools a replay is best at teaching, and the fifteen-minute-delayed live session is a useful bridge between recorded practice and a real account. Five years of history also matters more than it sounds: two years of replay can easily be two years of one regime, and the point of practice is to have seen the other kind.
Execution and Order Flow
Order entry is modelled on a live platform rather than simplified. The trade ticket takes price, size, stop loss and take profit; orders can be placed and adjusted directly on the chart; hotkeys can be customised for fast entry; and the order types include market, limit, stop, bracket orders that pair a profit target with a stop, and order-triggers-order entries that set both targets at the moment of entry. The day-trading page states that fills execute against the actual historical bid and ask, so slippage and spread appear in the simulated result rather than being assumed away. That is the single most valuable property of a good simulator, because the Library's entry on execution cost modelling makes the point that the gap between a strategy's theoretical and realised results is mostly spread, slippage and fees, and replay is where you first see that gap with your own orders.
The order-flow tools replay historical market depth and every print on the tape. Level 2 shows the bid and ask stacking with intraday and pre-market highs and lows and limit-up and limit-down levels marked, alongside VWAP, ATR and relative volume, and the time and sales view highlights block trades and dark-pool transactions. A trader learning to read the tape can therefore rewind a moment, watch the book absorb size and replay it until the pattern is recognisable, which is not possible in a live paper account.
Finding Setups and Organising Sessions
The scanner runs during replay and updates as the session advances, so a pre-market gap scan at 9:00 shows what it would have shown that morning. Documented filters include pre-market volume, float and market capitalisation, pre-market gap percentage, short interest, top gainers, volume spikes and sector, and results can be saved into watchlists alongside index lists such as the Dow 30, the S&P indices, the Nasdaq 100 and Composite and the Russell 2000. Workspaces hold the layout for each strategy, and bookmarks turn a replay into a reference library: mark every opening-range breakout you traded this month, categorise them, and review the set rather than the anecdote.
The discipline these tools reward is choosing the session before you open it. Pick the date for a reason, a known earnings gap, a Fed day, a quiet summer Friday, and write the reason down, because a session chosen at random tests nothing in particular and a session chosen because you remember how it ended tests nothing at all.
Analytics and What to Do With Them
Every simulated trade is tracked automatically. The analytics report P&L, win and loss ratios, trade efficiency, average hold time, P&L by setup and progress over time, and the site frames them as the way to find where a trader is leaking. The Library supplies the vocabulary for reading them. Expectancy is the average result per trade across the whole distribution, win rate times average winner minus loss rate times average loser, and it is the only figure that says whether the process makes money before size is considered; a high win rate with an occasional large loser can still be negative. The R-multiple framework expresses each outcome as a multiple of the risk taken at entry, which lets sessions traded with different account sizes and instruments be compared on one scale, and it is the natural unit for a simulator where the account balance is arbitrary.
Two cautions. First, simulated fills against a historical book are realistic for size that the book could absorb; a large simulated order that would have moved the market is filled as if it did not, so keep simulated size at the level you would actually trade. Second, hindsight leaks. If you have any memory of the day being replayed, the analytics for that session measure recall, not skill, so favour dates you have no reason to remember.
A Deliberate Practice Protocol
- Write the setup first. One paragraph: the pattern, the entry trigger, the stop placement, the target or exit rule and the maximum size. The analytics can only attribute P&L to a setup that existed before the session.
- Choose the session for a reason and note it. Rotate between quiet and volatile days and between years so the sample spans regimes.
- Trade at realistic size and mostly at real speed. Use fast-forward to reach the open, then let the session run.
- Bookmark every trade and every setup you saw but did not take. The untaken ones are half the data.
- Review in R. Convert each result to a multiple of its initial risk and compute expectancy per setup once you have thirty or more instances.
- Change one thing per week. A stop rule, an entry filter, a session window. Compare the expectancy before and after; discard changes that do not move it.
- Log it outside the simulator so the record survives the subscription and sits next to your real trades.
Where Quant Charts Fits
A replay simulator answers one question: can you execute a rule under realistic conditions? It cannot answer the prior question, does the rule have an edge, because a handful of sessions is a handful of sessions. That question belongs on Quant Charts. Describe the rule to Quant, LuxAlgo's coding agent, in plain language, for example buy an opening-range breakout on the five-minute chart when relative volume exceeds two, with a stop at the range low and a two-R target. Quant writes the Pine Script, you inspect it under Code and click Run, and the Backtest Summary reports net profit, trade count, win rate, maximum drawdown and profit factor across the chart's full history, with commission and slippage set in the strategy Properties so the result is costed. If that summary is poor, no amount of replay practice will fix it; if it is good, replay is where you learn to take the trades it describes.
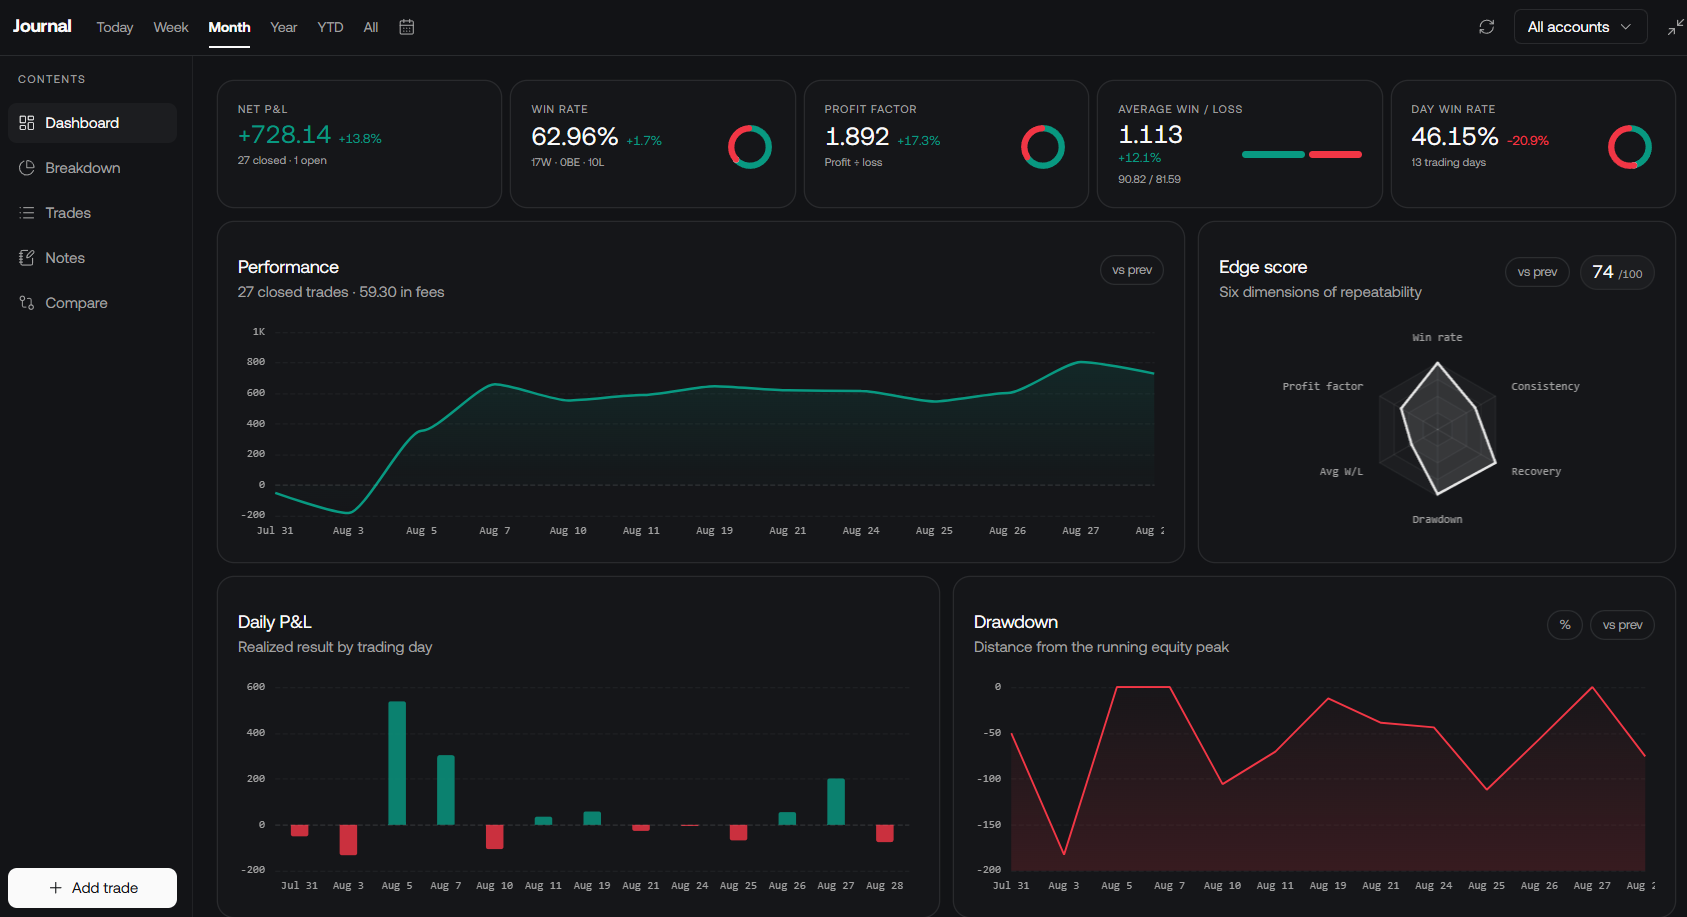
The record of the simulator sessions belongs in the Journal on Quant Charts, which is included on every plan and lives on your account rather than inside a workspace. A manual account takes fills you add by hand, including from the chart, so simulated trades can sit beside broker-synced real ones. The dashboard then reports net P&L, win rate, profit factor, average win against average loss and day win rate, an equity curve and drawdown, expectancy per trade, streaks and best and worst days, and an Edge Score, a composite of six repeatability dimensions that appears after five closed trades and which the docs ask you to read as a repeatability measure rather than a guarantee. Expectancy in R requires a stop loss on each logged trade, which is one more reason to write the stop into the setup before the session.
There is a third kind of simulation worth naming, because traders who practise in a replay engine often do so to pass a prop-firm evaluation. LuxAlgo's prop-firm pass-rate simulator runs ten thousand Monte Carlo paths of a trader profile, win rate, average winner in R, trades per day and risk per trade, against the exact published rules of a chosen challenge, every drawdown mode, daily-loss switch, consistency rule, fee and payout gate, with the engine open source and every run reproducible from its link. The Library's entry on prop-firm rule mechanics explains why this matters: in an evaluation account the binding risk is the rule threshold, often only a few percent from the starting balance, not the market. Replay teaches you to trade the setup; the pass-rate simulator tells you whether the setup's statistics survive the account's rules. No LuxAlgo tool places orders at a broker; execution, real or simulated, happens elsewhere.
Where Each Tool Stops
TradingSim stops at simulated execution and its own analytics; it does not backtest a rule across history or route orders. Quant Charts stops at research, the costed backtest and the Journal, and does not simulate order-book fills. LuxAlgo's Signals & Overlays, Price Action Concepts and Oscillator Matrix toolkits run on TradingView, a separate charting environment, and the legacy Backtesting Assistant and Strategy Alerts are TradingView-side products distinct from the Backtest Summary on Quant Charts. A brokerage's own paper account remains the final rehearsal before capital, because it uses the broker's actual order routing and platform.
Conclusion
TradingSim does one thing well: it puts you inside a recorded session with the book, the tape, the scanner and a realistic order ticket, and lets you repeat the moments that matter until the reaction is automatic. Used with a protocol, defined setups, chosen sessions, realistic size, R-based review and an external log, its analytics become a genuine measure of execution skill. Used without one, it is an expensive way to confirm what you already believed about a day you half remember. Put the research first on Quant Charts, where Quant writes the rule and the Backtest Summary judges it with costs; rehearse the execution in replay; record both in the Journal; and, if the goal is a funded account, run the statistics through the pass-rate simulator before paying an evaluation fee.
Key Takeaways
- TradingSim replays real tick sessions for US equities, futures and crypto with synchronised charts, Level 2, tape, scanner and order entry.
- Pro is $396 a year and Premium $449; Premium adds five years of history, tick and second charts, Level 2 and delayed live sessions.
- Define setups before the session so P&L by setup and expectancy measure skill rather than storytelling.
- Backtest the rule with costs on Quant Charts first; replay is for execution, not for discovering edges.
- Log simulated trades in the Journal and test account rules in the prop-firm pass-rate simulator.
FAQs
What is TradingSim?
TradingSim is a browser-based market replay simulator. It plays back recorded tick data for US stocks, futures and crypto from a chosen past session, with charts, Level 2, time and sales, scanners and a trade ticket all synchronised, so you can practise trading the day at adjustable speed without a brokerage account.
How much does TradingSim cost?
As of September 2026 there are two annual plans with a seven-day free trial: Pro at $33 per month billed annually at $396, and Premium at $37 per month billed annually at $449. Premium adds five years of history instead of two, tick and second charts, Level 2 data and live sessions on a fifteen-minute delay.
How is replay different from a broker's paper account?
A paper account runs at the speed of the live market during market hours. A replay engine lets you choose any recorded date, start in the pre-market, pause, rewind and run at half to ten times speed, and repeat a moment until the reaction is learned. The paper account is still the final rehearsal because it uses the broker's real routing.
Can TradingSim backtest a strategy?
Not in the statistical sense. It records the trades you take in replayed sessions and reports P&L, win rate and hold time, but a few sessions are not a test of a rule across history. Backtest the rule first, for example on Quant Charts where Quant writes the strategy and the Backtest Summary reports net profit, trade count, win rate, maximum drawdown and profit factor with costs.
How should I record simulator trades?
Keep the log outside the simulator. On Quant Charts the Journal accepts a manual account with fills added by hand, and its dashboard reports win rate, profit factor, average win and loss, expectancy per trade and drawdown, plus an Edge Score after five closed trades. Log the stop on each trade so expectancy can be shown in R.
Does replay practice show whether I would pass a prop-firm challenge?
Only indirectly. Replay measures execution; a challenge is decided by account rules such as daily loss and trailing drawdown. Take the win rate, average winner in R and trades per day from your logged sessions and run them through LuxAlgo's prop-firm pass-rate simulator, which applies each firm's published rules across ten thousand Monte Carlo paths.
References
LuxAlgo Resources
- Quant Charts
- Quant: making strategies and the Backtest Summary
- Journal overview
- Journal dashboard and Edge Score
- Prop-firm pass-rate simulator
- Library concept: expectancy
- Library concept: R-multiple framework
- Library concept: execution cost modelling
- Library concept: prop-firm rule mechanics
- Library concept: in-sample / out-of-sample split
- Library: Historical Price Projection
External Resources
Read next