Bitcoin Power Law
 By LuxAlgoJun 18, 2025
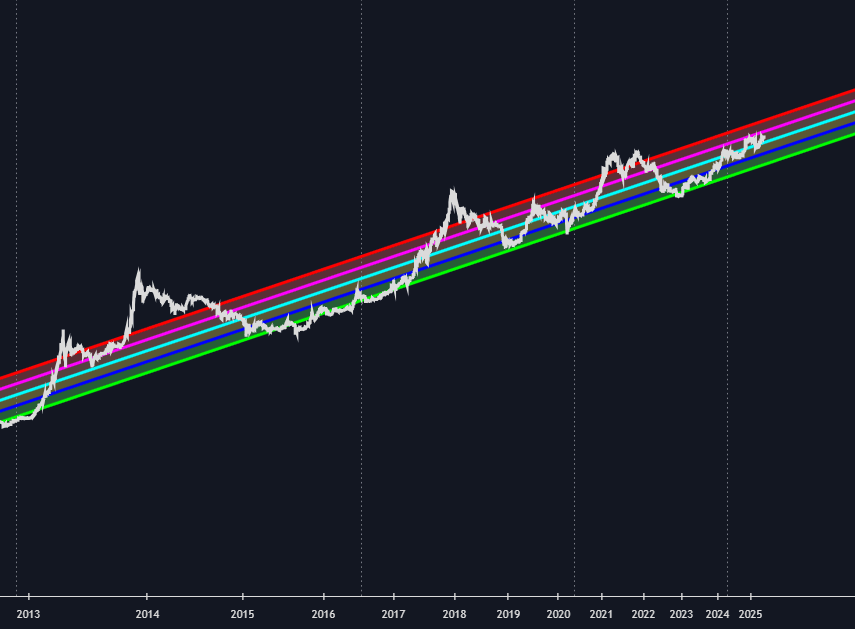
The Bitcoin Power Law brings Giovanni Santostasi's power-law theory straight onto the chart: daily Bitcoin closes plotted on double-logarithmic axes and wrapped in a precision-fit regression channel. It is a long-term cycle model reduced to essentials (one power-law growth curve with symmetric bands scaled by the fit's root-mean-squared error), splitting Bitcoin's history into discounted, fair-value, and overheated territory. It is calibrated exclusively for the daily BTCUSD chart; other tickers or timeframes invalidate the calculation.
How to Trade the Bitcoin Power Law?
- Lower channel (accumulation): historically aligned with cycle lows, the zone long-horizon entries and DCA plans watch.
- Middle channel (fair value): neutral trajectory. Monitor for breakouts or mean-reversion here rather than chase.
- Upper channel (overheated): has coincided with parabolic blow-offs and cycle tops, a caution area for profit-taking or tightening stops.
- Halving markers: dotted vertical lines locate each halving against the channel's geometry.
Sharp departures into the upper band have tended to revert, so the practical discipline is watching where price sits inside the channel rather than reacting to headlines. For a closer look at recent action, the linear-time option trades some channel precision for resolution.
Bitcoin Power Law Settings
- Start Calculation (default 15 Jul 2010): the first day included in the regression.
- Use Linear Scale for X-Axis: swaps log(time) for calendar time. Higher short-term resolution, less exact fit.
- Show Regression Line: toggles the central trend line, with a color picker.
- Mult 1-4 (defaults +1, +0.5, -0.5, -1): the channel multipliers, each with line and fill options; tighter values give faster reads, wider ones capture macro swings.
- Style: price line color and width, auto color, and the halving markers.
Frequently Asked Questions
Free indicator
Get free access to this indicator on the platforms below.

The Library is free. Quant makes it yours.
Pull any concept or indicator into Quant: rebuild it, retune it, or turn it into a backtested strategy of your own.