Concept
Crypto Cycle Models
Crypto Cycle Models, also known as pi-cycle top, stock-to-flow — discredited but famous, are Breadth, Sentiment & External Data concepts. The Library holds 3 implementations, each one a working definition you can pull into Quant.
Top Crypto Cycle Models indicators
The top custom implementations, built on the original standard Crypto Cycle Models formula.
3 total
Every Crypto Cycle Models implementation here is strategy-ready: open one in Quant, set your rules, and it backtests automatically.
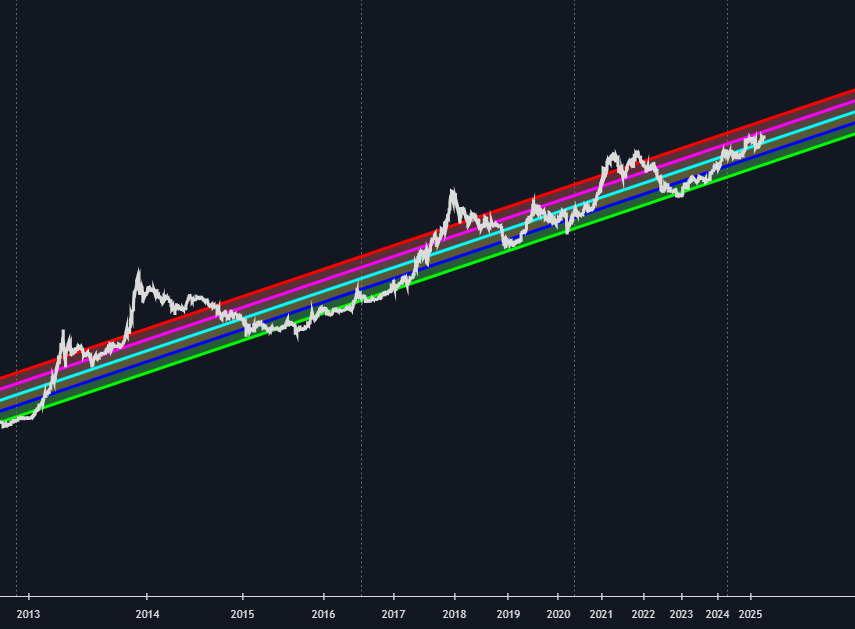
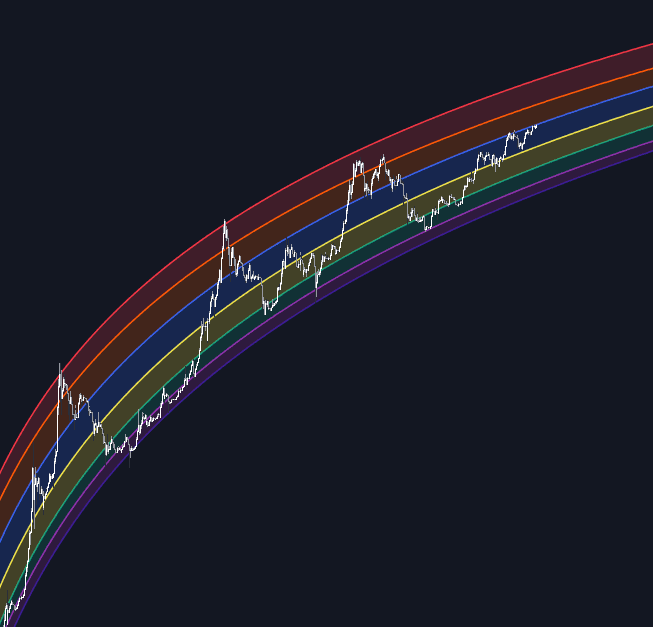
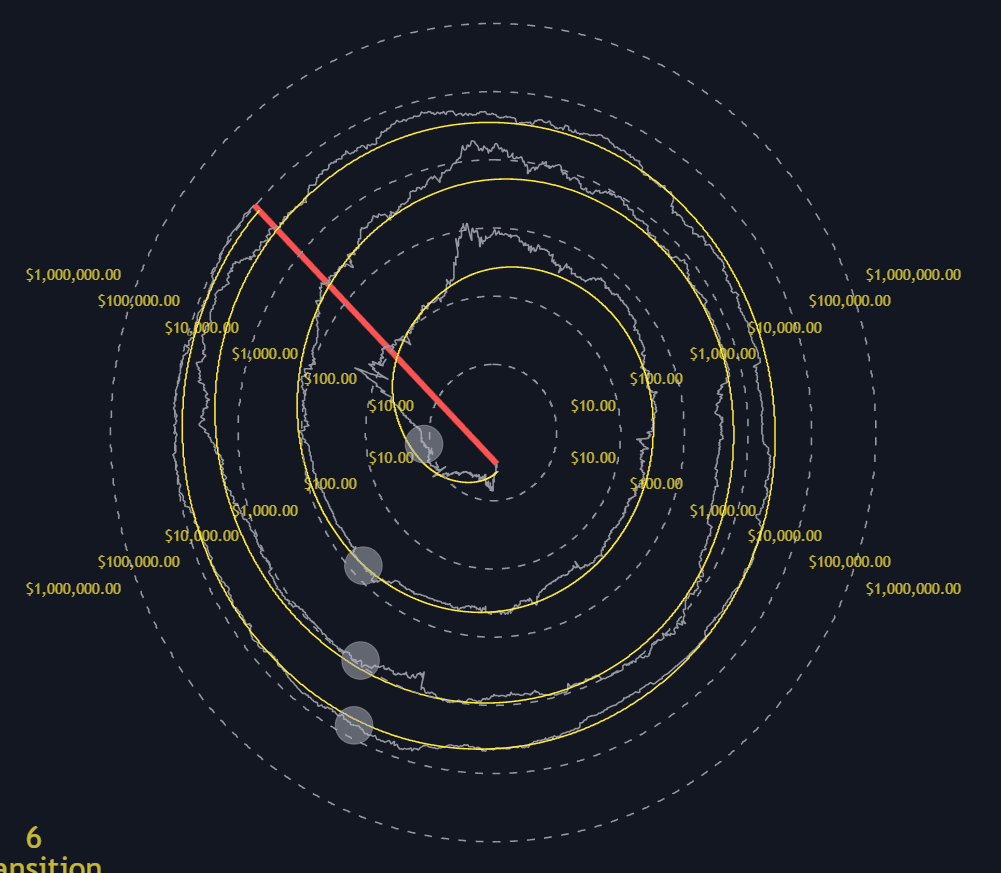
What are Crypto Cycle Models?
Crypto cycle models are frameworks for estimating where Bitcoin, and by extension the wider crypto market, sits inside its multi-year boom and bust sequence, which has historically tracked the roughly four-year halving cadence. Instead of generating trade signals, they estimate phase: accumulation, markup, euphoria, decline, bottom. The genre includes the pi-cycle top (a cross of the 111-day simple moving average above two times the 350-day SMA that landed near several prior peaks), logarithmic regression and power-law growth curves fitted to all of price history, the famous and now widely criticized stock-to-flow scarcity model, and valuation bands such as MVRV from the on-chain valuation suite.
The genre grew up with Bitcoin itself. The four-year narrative took shape after the 2012 and 2016 halvings each preceded major bull markets; log-regression rainbow charts circulated from around 2014; the pseudonymous analyst PlanB published stock-to-flow in early 2019, and Philip Swift introduced the pi-cycle top the same year. Power-law treatments have been argued for by researchers such as the physicist Giovanni Santostasi. Each model's fame tracks a cycle it appeared to call, and each subsequent cycle has tested that fame.
Every model in this family deserves statistical humility. Bitcoin has completed only a handful of full cycles, so any curve fitted to that history is trained on a tiny sample, and models are often refit as new data arrives, which flatters their track record. Structural change (spot ETFs, institutional flows, the shrinking supply impact of each halving) may bend or break past geometry. The honest use is context: a cycle model can say price is historically stretched or historically depressed relative to its own past, not that a top or bottom is due on a date.
In practice cycle models are read alongside faster market data rather than instead of it. Derivatives conditions such as open interest, funding, and implied volatility describe how positioning is being built; exchange and stablecoin flows track whether coins are moving toward or away from sale; rotation gauges such as the ETH/BTC ratio chart describe risk appetite within the asset class. The cycle model supplies the slow variable; these faster series fill in the rest.
How to read a cycle model on a chart
Cycle models live on long-horizon charts, and most reading errors come from viewing them at the wrong scale.
- 1Use a weekly or monthly chart on a logarithmic scale with full price history; mainstream cycle models are defined in log space, and on a linear scale their bands become unreadable.
- 2Overlay the model's bands or curves, whether a regression corridor, power-law support and resistance, or valuation bands, and locate current price within the band structure rather than against any single line.
- 3Mark the halving dates and note time elapsed since the last one, since most models in the genre are anchored, explicitly or implicitly, to that cadence.
- 4For the pi-cycle top specifically, plot the 111-day SMA against two times the 350-day SMA and watch for the upward cross, remembering it gave no signal at the November 2021 high.
- 5Cross-check the implied phase against independent data before acting: stretched price with restrained on-chain and flow readings is a different situation from stretched everything.
How traders use it
- As a macro filter over faster tools: lean toward accumulation-side tactics when price sits in a model's lower bands and toward de-risking when it stretches far above the long-run curve, letting shorter-term structure handle the actual entries.
- As a top-watch checklist rather than a sell trigger: extreme readings (a pi-cycle cross, price several bands above the regression corridor, stretched on-chain valuation) argue for tightening stops and scaling out, not for shorting on sight.
- For dollar-cost-averaging plans: accumulation-band models give long-horizon buyers a framework for scaling purchase size with cycle depth instead of buying a fixed amount regardless of context.
- As one voice in a cross-check, never alone: a cycle-model extreme gains weight when independent families, such as on-chain metrics like SOPR, funding conditions, and exchange flows, say the same thing.
- For altcoin timing: Bitcoin's estimated phase is widely used as the risk backdrop for the rest of the asset class, with relative strength and dominance ratios deciding which assets, if any, deserve the exposure the phase allows.
Crypto Cycle Models vs related concepts
On-chain Valuation Suite: On-chain models value the network from blockchain data (cost basis, realized value, holder behavior), while cycle models in the narrow sense work from price and time alone. Many dashboards blend both.
Exchange & Stablecoin Flows: Flow metrics watch coins and stablecoin dry powder moving between wallets and venues in near real time; cycle models operate on years. Flows can say distribution is happening now; a cycle model can only say the phase where distribution would be unsurprising.
Open Interest: Open interest describes leverage and participation in derivatives at the current moment, resetting with every washout. Cycle models ignore positioning entirely and work from price and time. The two fail differently: crowded leverage can end a rally mid-cycle, and a cycle extreme can arrive with unremarkable positioning.
Concept family
Breadth, Sentiment & External Data
63 concepts mapped · 63 in the Library
Crypto Cycle Models FAQ
Turn Crypto Cycle Models into a trading strategy.
Take any implementation from this page into Quant, then build on it, backtest it on real data, and keep refining it in conversation.