Concept
Power-law Growth Curves
Power-law Growth Curves, also known as Bitcoin power law, are Breadth, Sentiment & External Data concepts. The Library holds 1 implementation, a working definition you can pull into Quant.
Top Power-law Growth Curves indicator
The top custom implementation, built on the original standard Power-law Growth Curves formula.
1 total
From studying Power-law Growth Curves to trading it: take the implementation below into Quant and backtest it instantly.
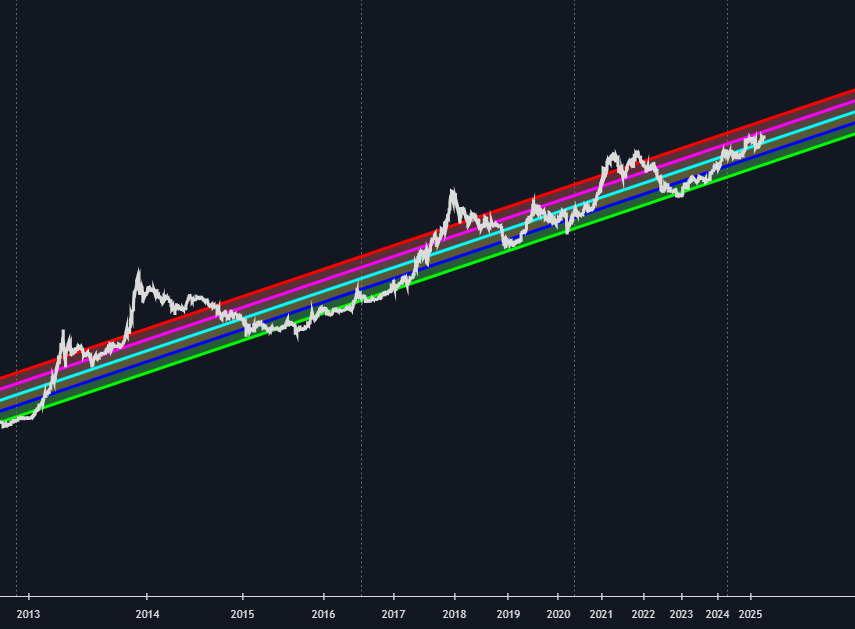
What are Power-law Growth Curves?
Power-law growth curves model an asset's long-run price as a power function of time: price proportional to elapsed time (measured from some origin, such as Bitcoin's genesis block) raised to a fixed exponent. On log-log axes, where both price and time are logarithmic, a power law plots as a straight line, so the model is fitted as a simple linear regression of log price on log time. Parallel rails offset above and below the fit form a growth corridor. The best-known application is the Bitcoin power law, a fit popularized by quantitative analysts studying its multi-year price history.
Read strictly, the model claims growth decelerates in a specific way: each doubling of the asset's age multiplies price by a constant factor. Its appeal is that price has so far stayed inside a corridor around one fitted line across several cycles. Its weakness is the same as any curve fit: the sample is one asset's short history, the exponent depends on the chosen origin date and fitting window, and nothing enforces future adherence. It is a descriptive fit, not a law of nature, despite the name.
The specifics of the Bitcoin fit are worth knowing because they are what gets argued about. Published fits put the exponent in the mid single digits, meaning price has scaled roughly as age raised to the fifth or sixth power, with the exact value swinging on the origin choice, genesis block versus first traded price, and the fitting window; the corridor rails are commonly drawn through quantiles of the deviations, so historical bull peaks kiss the upper rail and bear lows the lower one by construction. The framework was popularized by physicist-analysts arguing the fit's multi-cycle stability resembles the power laws of natural growth processes, an analogy that remains an argument rather than a demonstration.
In the model zoo the power law is the deceleration thesis: against halving-anchored cycle models that schedule repeating four-year theater, it claims a single smooth trajectory whose cycles are noise around the trend, and its projections undercut the supply-model targets by design. Deployment is correspondingly modest: corridor position as multi-year valuation context tilting accumulation and distribution schedules, refits tracked over time since the corridor itself drifts as data arrives, and triangulation against measured fundamentals from the on-chain valuation suite, which anchor to usage rather than to age.
How to identify a power-law growth fit
One regression on transformed axes, plus the honesty bookkeeping around it.
- 1Fix the origin: the date age is measured from, genesis block conventionally for Bitcoin, noting that this choice moves the exponent.
- 2Transform both axes: log of price against log of elapsed time, where a power law is a straight line.
- 3Fit the line by least squares; the slope is the exponent, the fit the corridor's spine.
- 4Draw the rails: parallel offsets through chosen quantiles of the historical deviations, framing the growth corridor.
- 5Track the refit drift: re-estimate as data arrives and log how the corridor moves, since parameter stability is the model's actual testable claim.
How traders use it
- As long-horizon valuation context: distance from the fitted line, or position within the corridor's bands, frames current price as historically cheap or expensive on a multi-year scale, in the same spirit as other crypto cycle models.
- As cycle framing: past bull-market peaks appeared as temporary deviations toward the corridor's upper rail and bear lows near the lower rail, so some traders use band touches as regime markers rather than trade signals.
- As a check on extrapolation: because small parameter changes compound over years, projections are treated as scenario ranges, and refitting as new data arrives can shift the entire corridor.
- For allocation cadence: long-horizon accumulation and distribution schedules tilt with corridor position, buying patience near the lower rail and harvesting discipline near the upper one, always as tilt rather than trigger.
- In model triangulation: the power law's decelerating projections against halving-model targets and measured on-chain fundamentals form a disagreement worth watching, with the gaps between models mapping the honest uncertainty.
Power-law curves vs related long-horizon models
Crypto Cycle Models: Halving-anchored models schedule repeating cycles from the supply calendar; the power law claims one smooth age-anchored trajectory with cycles as noise around it. Their projections diverge increasingly with time, and the divergence is the informative part.
Linear Regression: The engine underneath: on log-log axes the power law is a straight-line fit, inheriting every regression caveat, window sensitivity, outlier influence, in-sample comfort, compounded by extrapolation across years. The transformation changes the axes, not the epistemology.
On-chain Valuation Suite: The suite measures live fundamentals, usage, cost basis, flows; the power law fits price against nothing but age. Measured versus asserted: when corridor position and on-chain gauges disagree, the disagreement deserves more attention than either claim alone.
Concept family
Breadth, Sentiment & External Data
63 concepts mapped · 63 in the Library
Power-law Growth Curves FAQ
Turn Power-law Growth Curves into a trading strategy.
Take the implementation from this page into Quant, then build on it, backtest it on real data, and keep refining it in conversation.