Bitcoin Power Law Clock
 By LuxAlgoJun 20, 2025
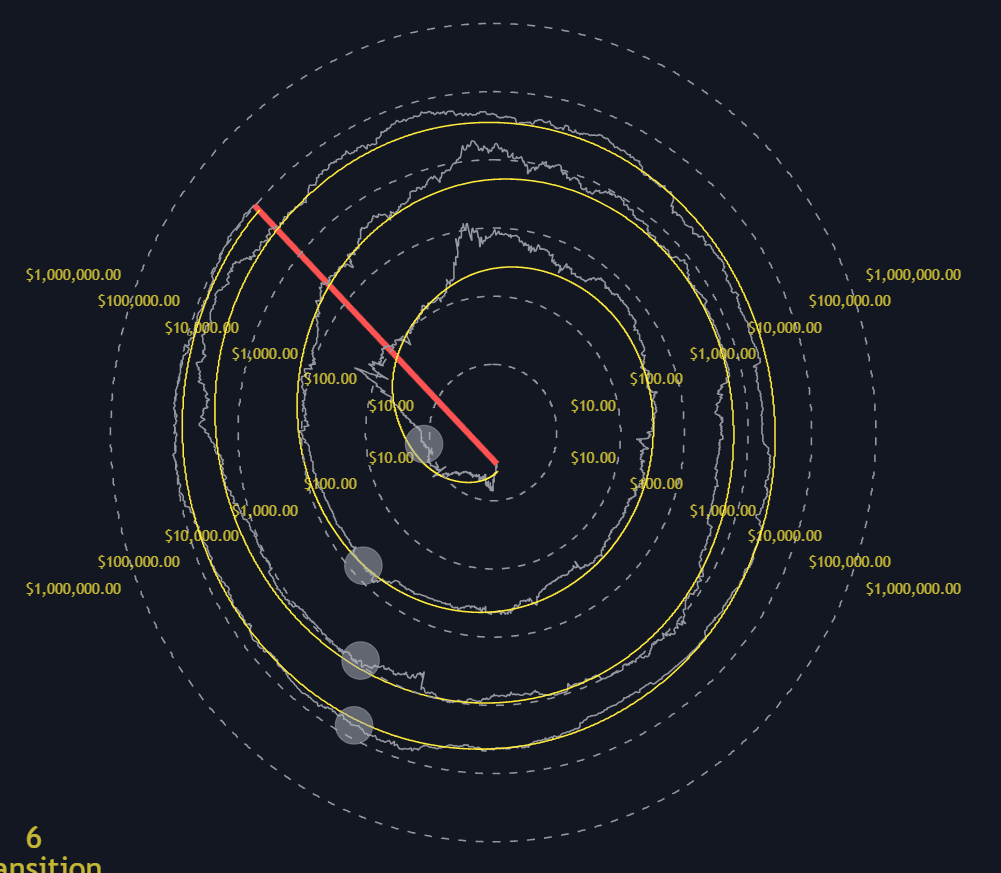
The Bitcoin Power Law Clock winds Bitcoin's entire price history around a 12-hour spiral, turning Giovanni Santostasi's power-law model into a clock you can read. Price and average lines spiral outward while a hand points at the current position, and the 12, 3, 6, and 9 o'clock marks correspond to the key phases of Bitcoin's macro cycle, historically aligning with tops, mid-cycle consolidations, bottoms, and early rallies. It is designed for the daily Bitcoin all-time-history index, which its time-based structure requires.
How to Trade the Bitcoin Power Law Clock?
- Hand position: the clock time is the cycle read. A hand around 10:20, as in the reference example, suggests the late stages of an upward cycle heading toward a top.
- Quarter marks: 12, 3, 6, and 9 flag the transitions between topping, consolidation, bottoming, and early-cycle conditions.
- Halving markers: past and upcoming halvings sit on the spiral, anchoring the cadence the model is built around.
- Dashboard: an optional time-and-price summary keeps the current reading pinned to a corner of the chart.
Every visual layer (spirals, curved rendering, hand, price scales, hour labels) toggles independently, so the display scales from a full instrument panel down to a minimal dial.
Bitcoin Power Law Clock Settings
- Price Spiral / Average Spiral: visibility, color, and curved rendering for each spiral.
- Auto Scale (enabled by default): resizes the spiral for any display; disable it to set a fixed size manually.
- Lines Width / Text Size: spiral thickness and label sizing.
- Prices / Handle / Halvings / Hours: individual toggles for price scales, the clock hand, halving markers, and the hour marks.
- Time & Price Dashboard: show or hide the summary, and choose its location and size.
Frequently Asked Questions
Free indicator
Get free access to this indicator on the platforms below.

The Library is free. Quant makes it yours.
Pull any concept or indicator into Quant: rebuild it, retune it, or turn it into a backtested strategy of your own.