5 Best Volume Indicators for Scalping

OBV, VWAP, MFI, CMF, and the Klinger Volume Oscillator offer five different ways to study price and volume for scalping. None is universally best, and no indicator makes a short-term trade low risk. Choose a tool for a defined purpose, then test whether it adds value after spread, commission, and slippage.
Start with LuxAlgo’s native charts for price context and use Quant to help implement a specified strategy. Keep the calculation, data source, session, and decision timing explicit before comparing results.
Compare the Five Volume Indicators
| Indicator | What it measures | Possible role | Main limitation |
|---|---|---|---|
| OBV | Cumulative signed volume based on close-to-close direction | Trend or divergence condition | Assigns the whole bar’s volume from one price comparison |
| VWAP | Volume-weighted price since a chosen anchor | Price reference or trend filter | Anchor and price source change the reference |
| MFI | Oscillator using directional typical-price × volume totals | Momentum or extreme-reading condition | Extremes can persist without a reversal |
| CMF | Volume-weighted closing position within bar ranges | Close-location or divergence condition | Does not directly account for gaps between bars |
| KVO | Difference between moving averages of Volume Force | Oscillator crossover or divergence condition | Crossovers can whipsaw and implementations need checking |
A one-minute setting is not inherently better than five minutes. A 14-bar lookback covers a different amount of time on each chart, and shorter bars make execution costs and intrabar assumptions especially important. Select the interval through a defined test rather than a universal “best timeframe” table.
1. On-Balance Volume (OBV)
OBV adds a bar’s volume when its close is higher than the preceding close, subtracts volume when it is lower, and remains unchanged for equal closes. The same rule can be applied to intraday bars; it is not restricted to days.
For example, starting at 10,000, an up-close bar with 2,000 volume followed by a down-close bar with 1,500 leaves OBV at 10,500. The starting value is arbitrary, so focus on changes under a consistent history rather than comparing absolute values across instruments.
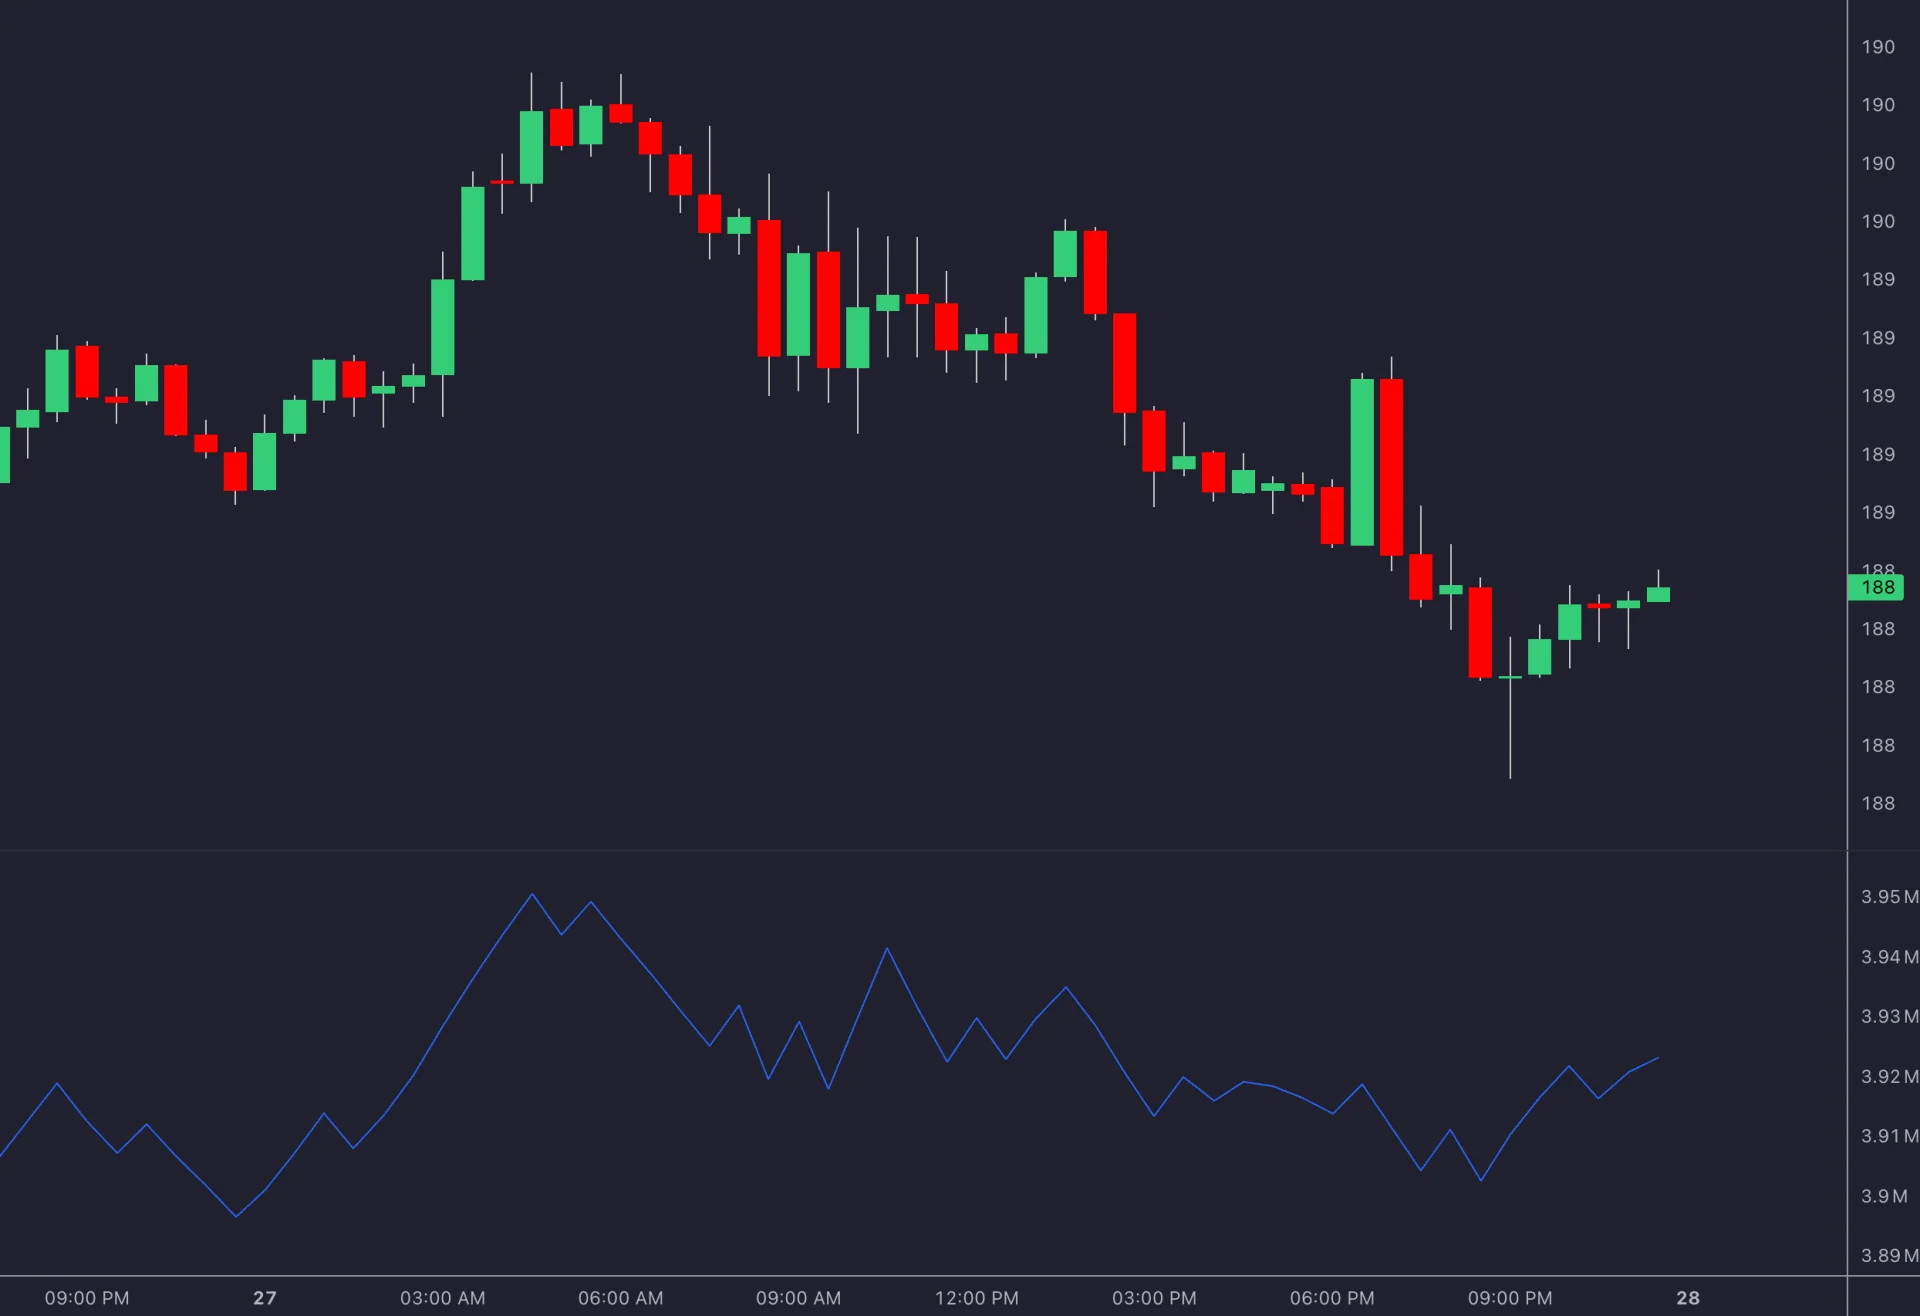
A possible scalping rule could require a price breakout plus rising OBV. Compare it with the same breakout without OBV. A higher OBV low against a lower price low may be a divergence candidate, but any required swing confirmation must be available before the trade.
OBV is not a direct aggressor-volume measure. A tiny price increase assigns the entire bar’s volume positively, even if substantial trading occurred while price was falling within the bar.
2. Volume-Weighted Average Price (VWAP)
VWAP divides the sum of price multiplied by volume by the sum of volume over the selected anchored period. It is a historical price reference, not an estimate of intrinsic fair value. Price above VWAP does not mean every participant is profitable or that a long trade has low risk.
For two observations of 100 units at $10 and 200 at $11, the volume-weighted price is $3,200 ÷ 300 ≈ $10.67. A chart implementation’s chosen price source and bar aggregation matter when comparing it with execution-level calculations.
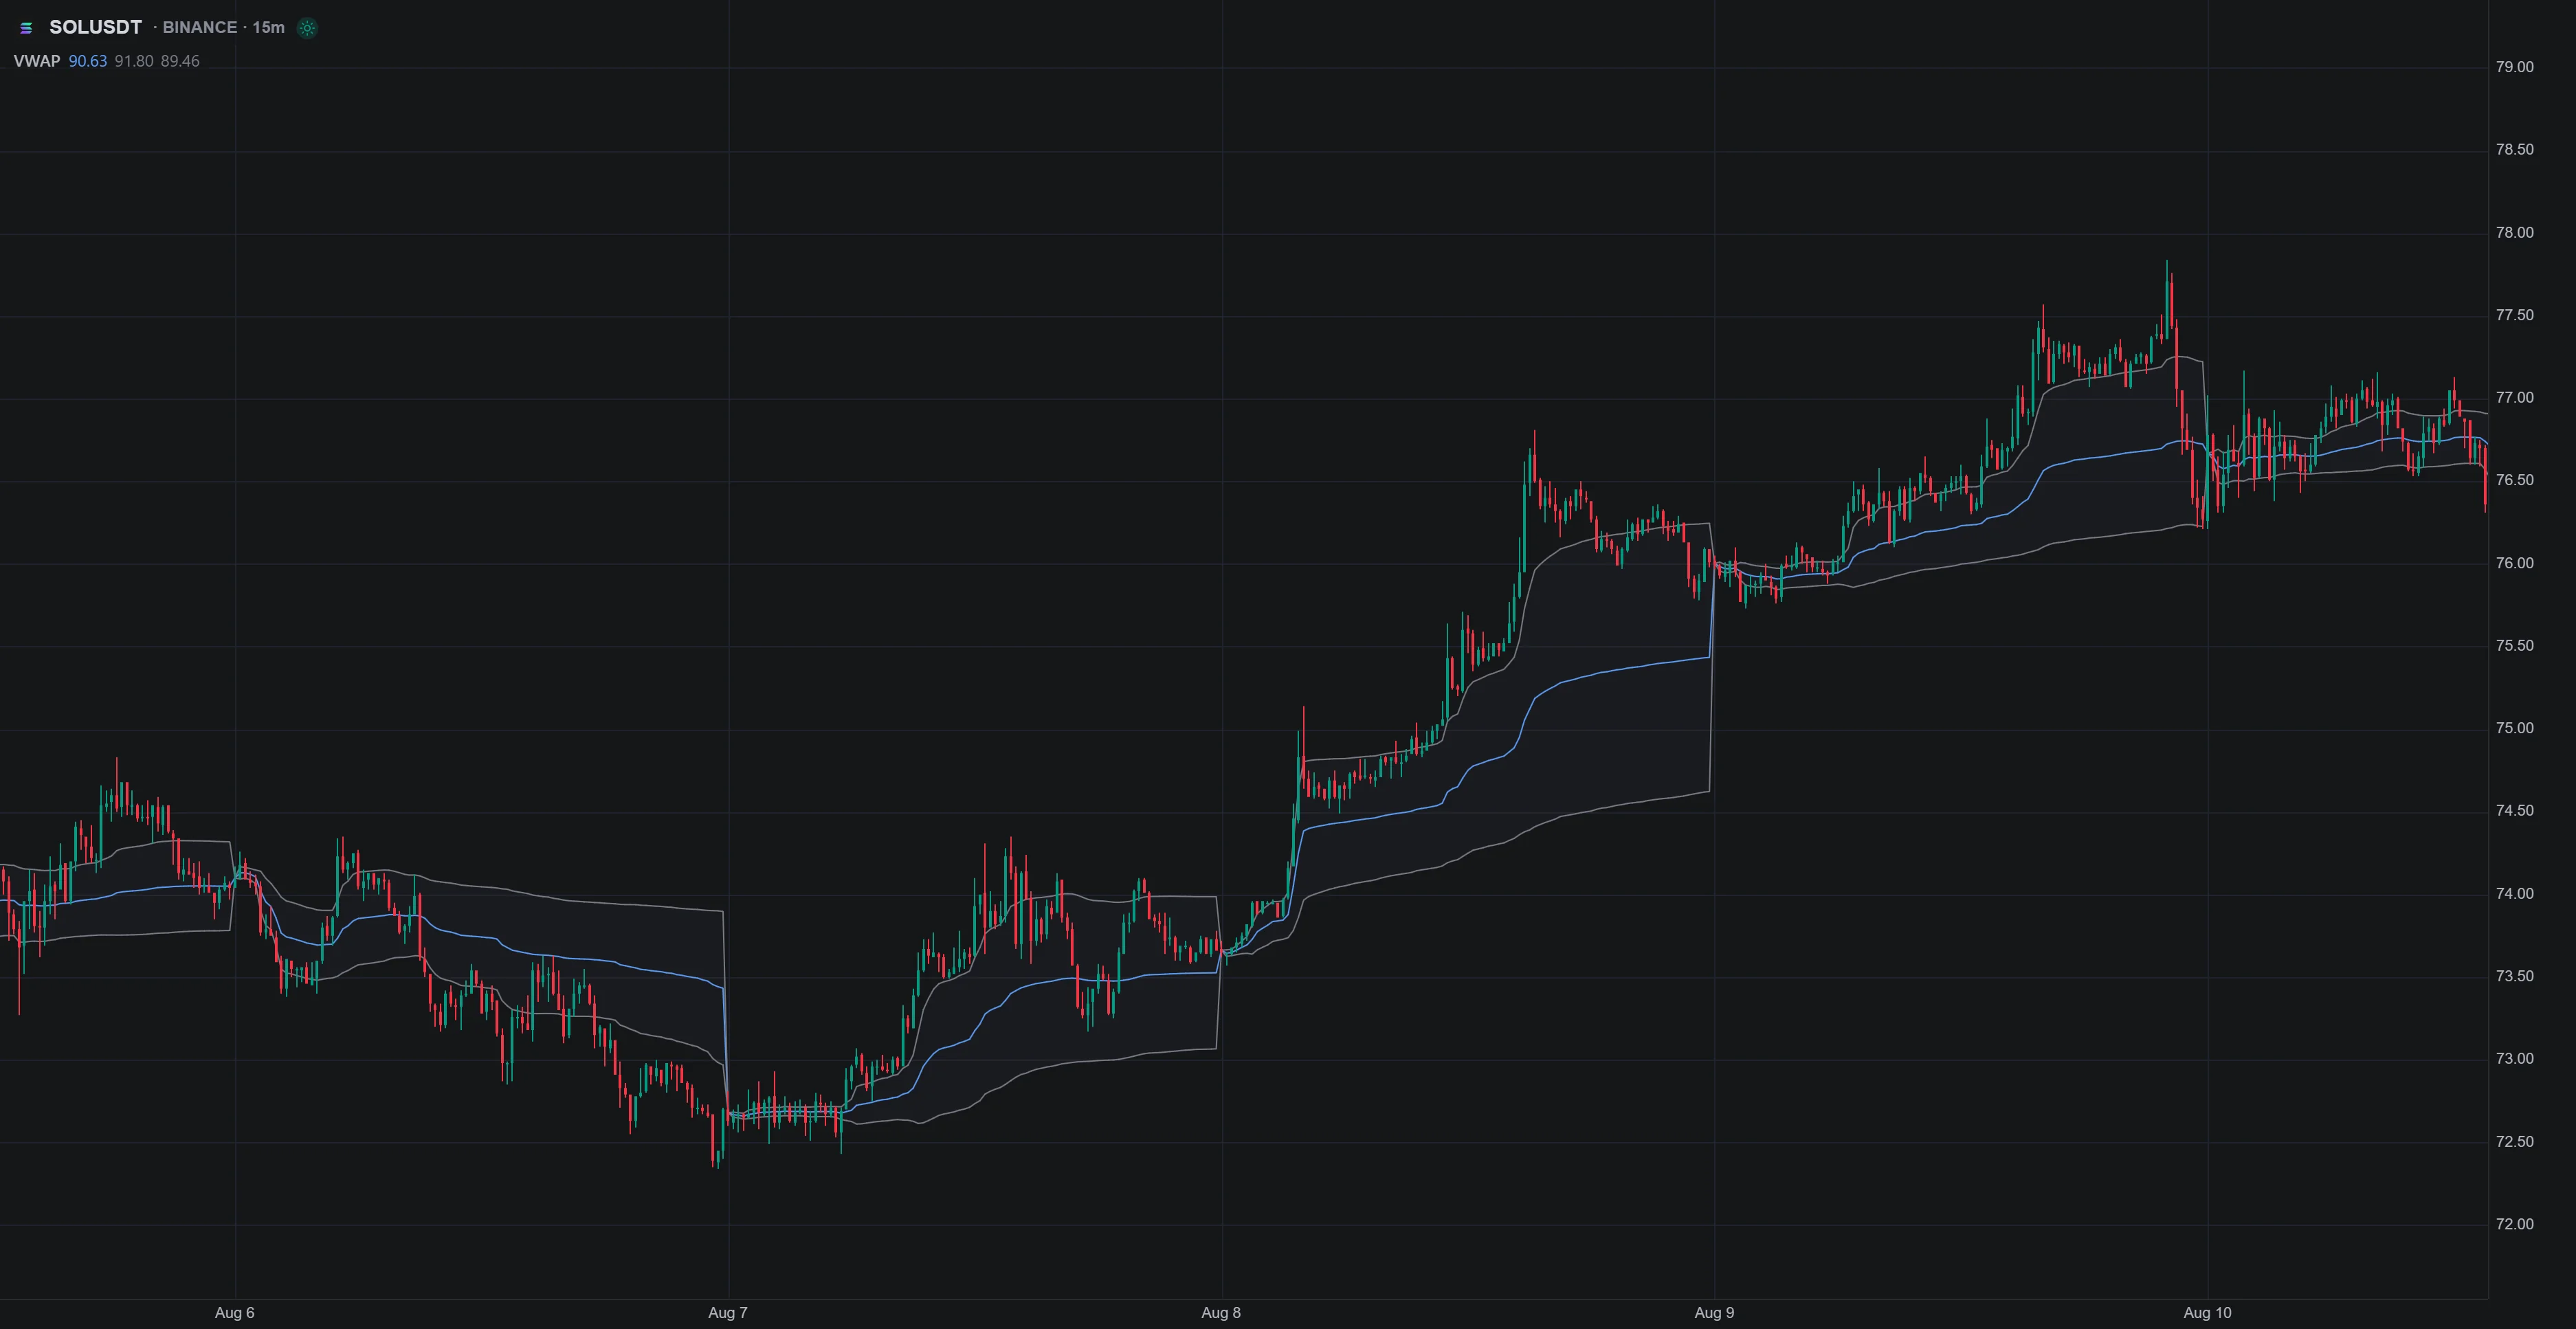
LuxAlgo’s native VWAP supports documented UTC-based anchors and price sources. A UTC day anchor should not be assumed identical to an exchange regular-session anchor.
Test a defined crossover, pullback, or location filter with explicit entry and exit timing. Repeated crosses in a sideways market can generate losses. A volume profile adds distribution by price, while VWAP provides an average; their agreement does not guarantee a better trade.
3. Money Flow Index (MFI)
MFI uses typical price, (high + low + close) ÷ 3, multiplied by volume. It groups these values according to whether typical price rose or fell, forms a positive-to-negative ratio over the lookback, and transforms that ratio onto a 0–100 scale.
If the positive-to-negative ratio is 3, MFI is 100 − 100 ÷ (1 + 3) = 75. Common reference levels are 80 and 20, but they do not mean “sell now” and “buy now.” Elevated or depressed readings can persist during a trend.
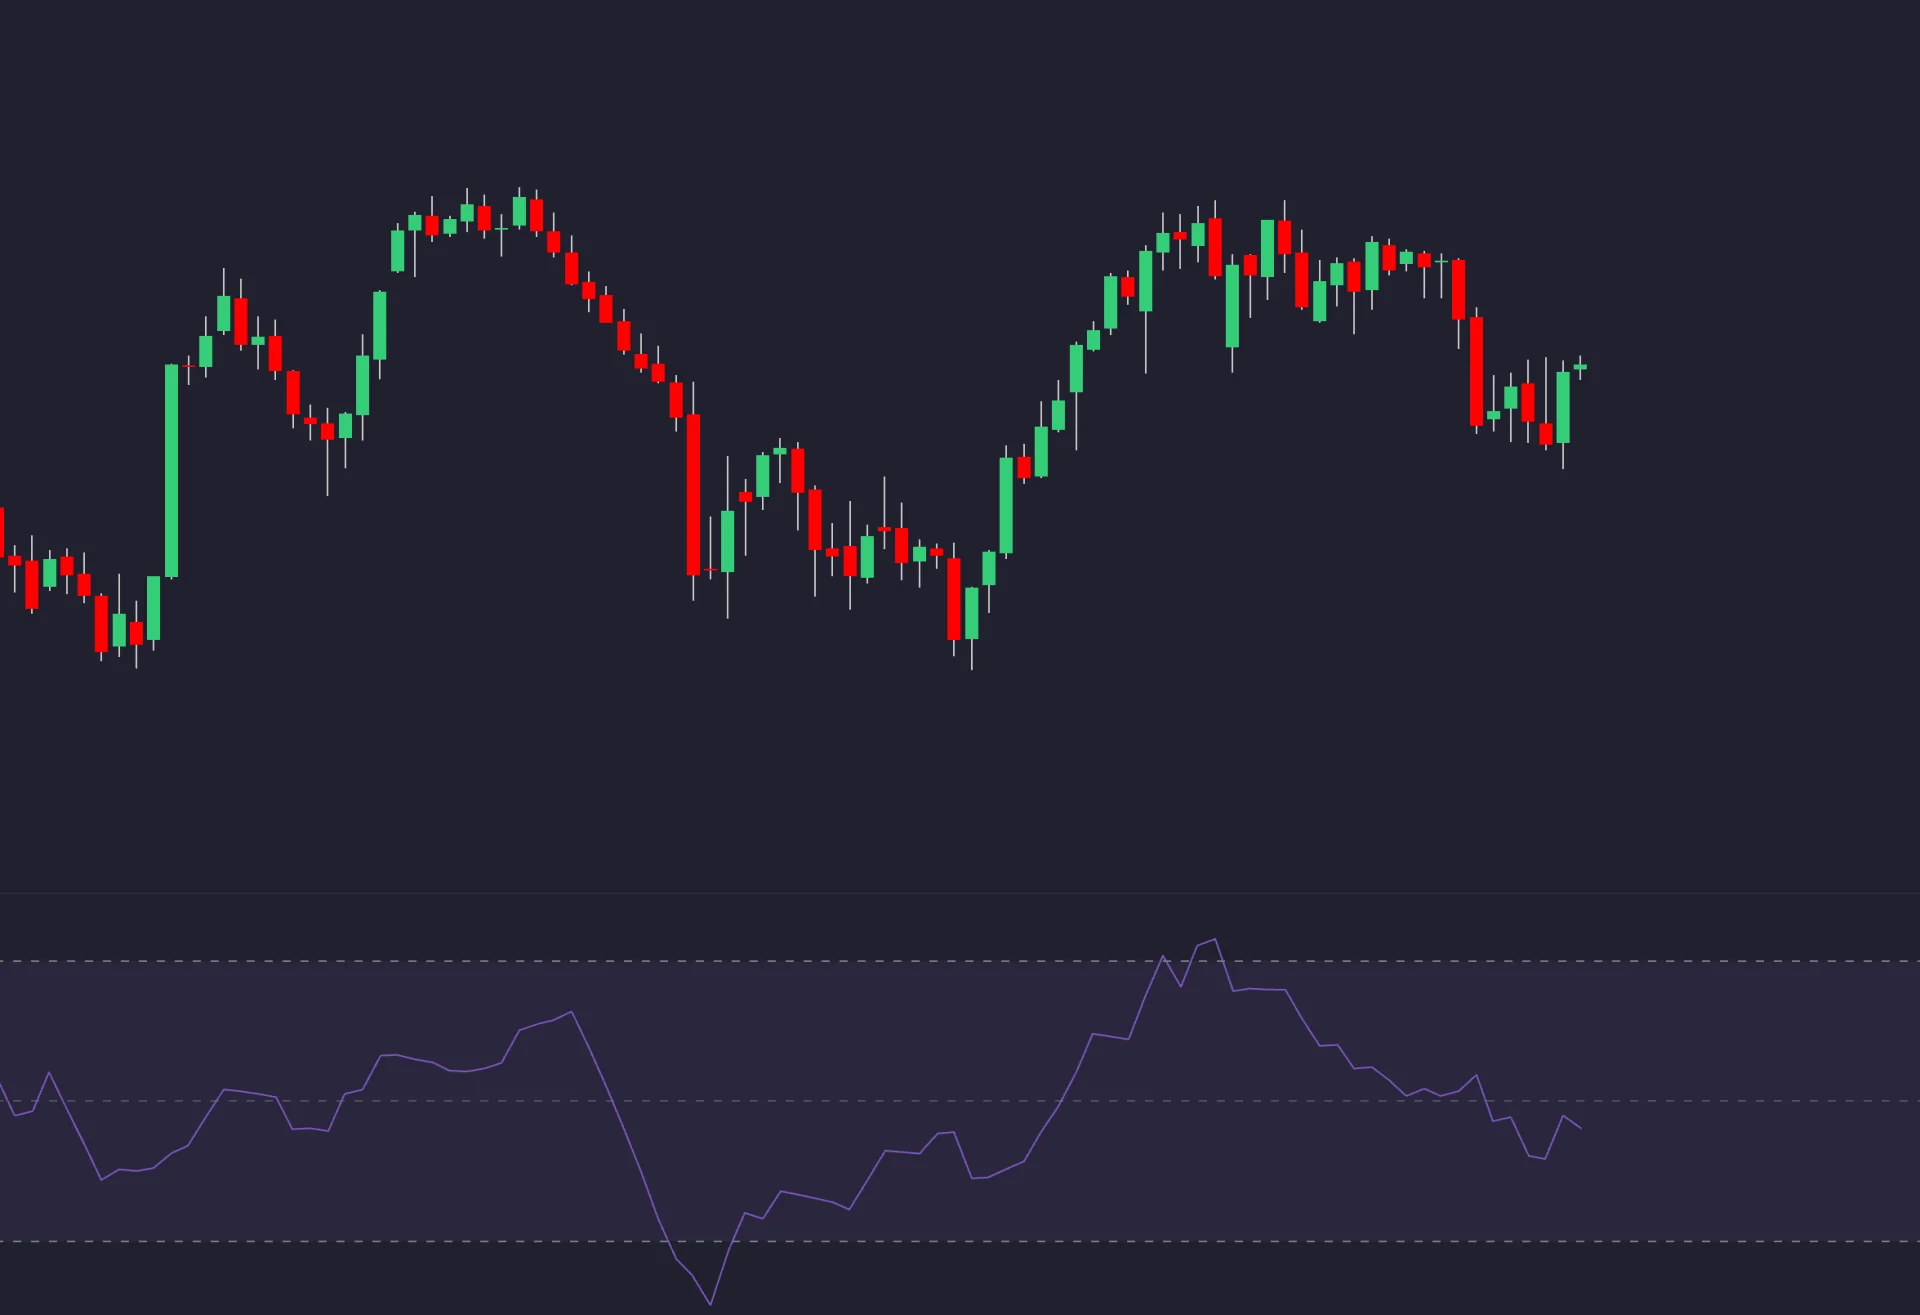
MFI is not a direct measure of cash entering or leaving an asset. It is also different from LuxAlgo’s Money Flow Profile; similar names do not establish the same calculation.
A strategy could test an extreme followed by a specified recovery and price trigger. Fix the lookback, threshold, and entry timing beforehand. Five-minute charts have no universal superiority for this method.
4. Chaikin Money Flow (CMF)
CMF weights volume by the close’s position within each bar’s high-low range, then divides the summed weighted volume by total volume over the window.
For a bar with high $110, low $100, and close $108, the multiplier is [(108 − 100) − (110 − 108)] ÷ 10 = 0.6. With 1,000 volume, its contribution to the numerator is 600. The final CMF includes the other bars in the chosen window as well.
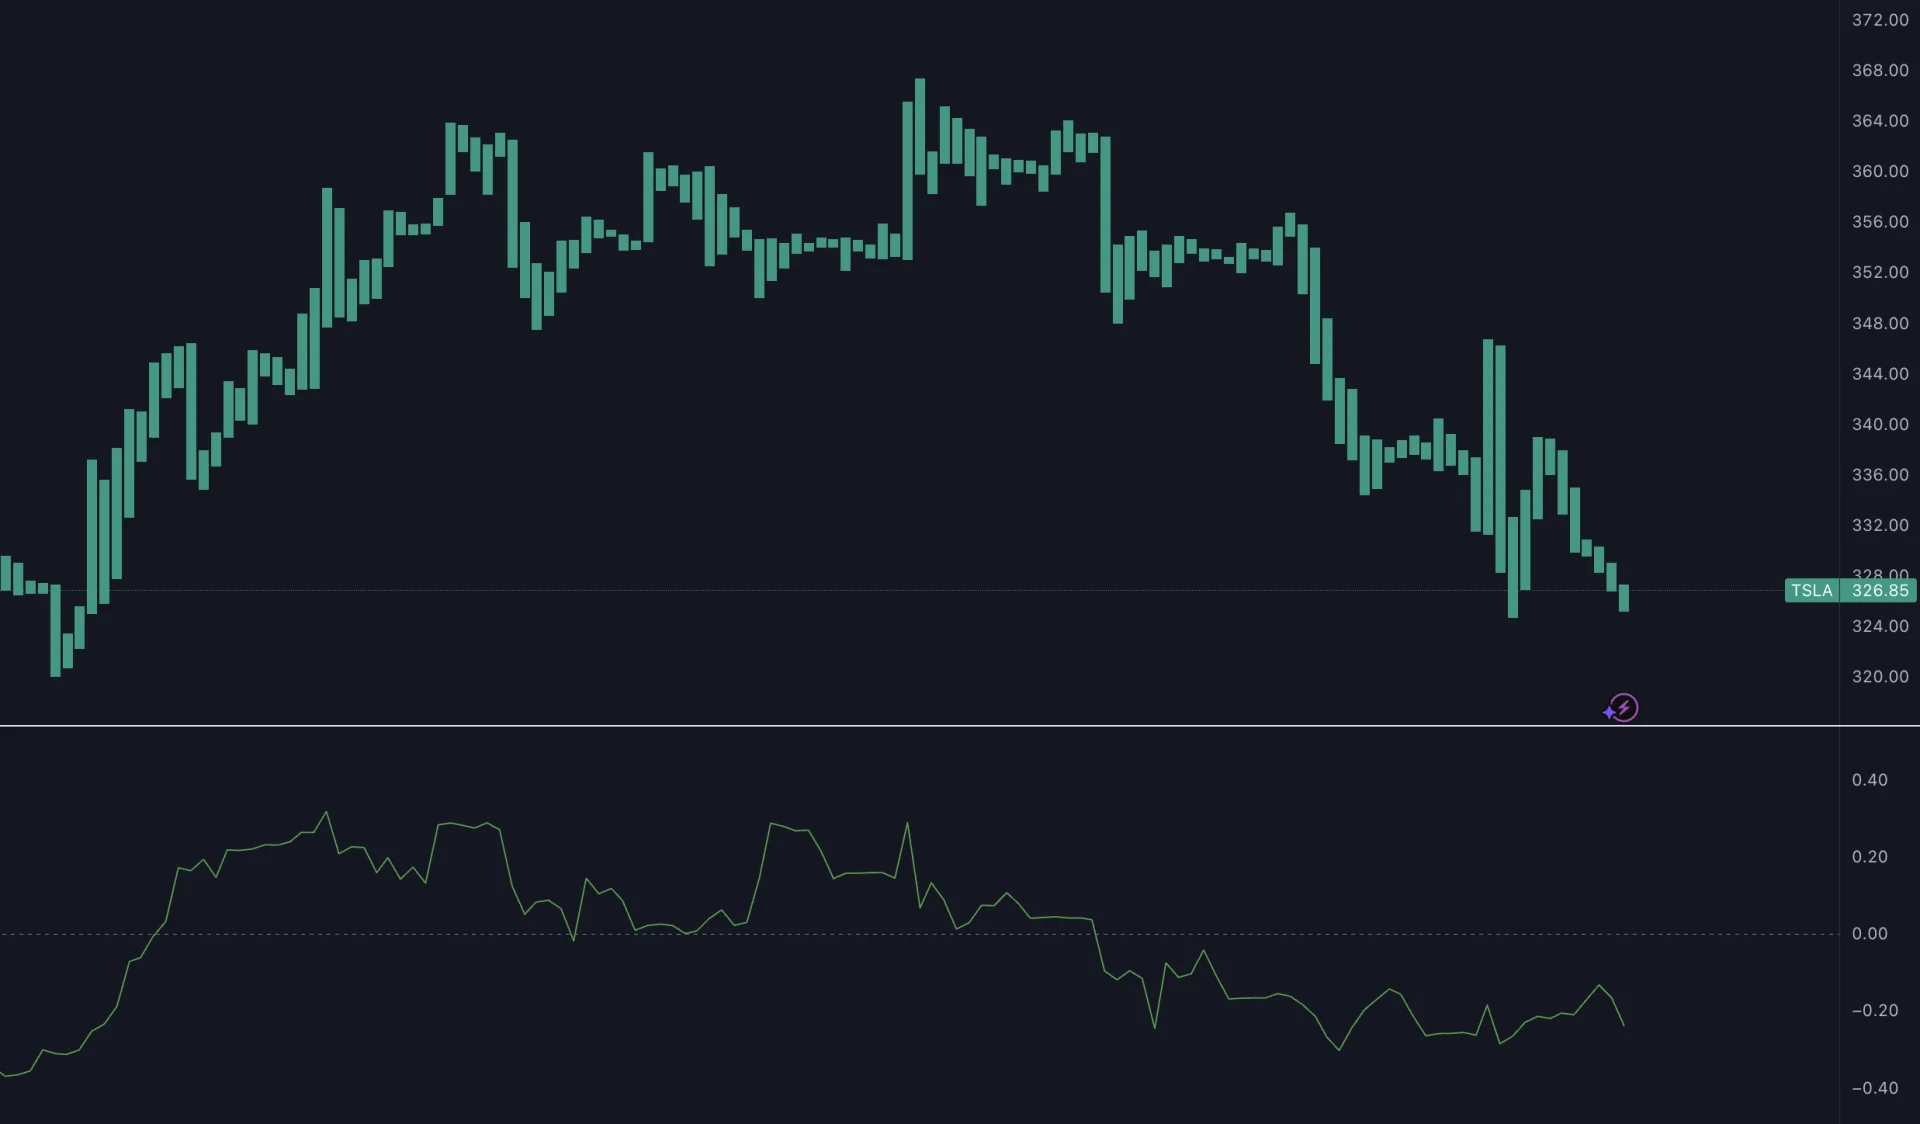
A positive CMF reflects the weighted tendency to close in upper portions of ranges. It can remain positive after a gap down because the formula does not directly compare the new range with the previous close. Specify handling for zero-range bars and zero total volume.
Levels such as +0.05 and −0.05 can be tested as buffers around zero; they are not universal definitions of strong buying or selling. A crossover or divergence still needs a price trigger, invalidation, and realistic execution assumptions.
5. Klinger Volume Oscillator (KVO)
The Klinger Oscillator commonly subtracts a 55-period exponential moving average of Volume Force from a 34-period EMA of Volume Force. That input combines volume with price direction and range-related calculations. It is not simply the difference between two averages of raw volume.
Consequently, a positive reading should not be translated as “total volume is rising.” Review the selected implementation’s Volume Force, initialization, and any signal-line settings before reproducing it in a strategy.
A zero-line or signal-line crossover is a candidate condition to test. Repeated crossings can whipsaw, and divergence may precede a reversal by a long time or fail to produce one. Neither one-minute nor five-minute use establishes an advantage by itself.
Choose a Combination with Distinct Roles
One price reference and one explicitly tested filter may be enough. OBV plus VWAP can combine cumulative directional volume with a price reference. MFI and CMF summarize different calculations but still share price and volume inputs; adding both does not create two independent confirmations.
Hold the underlying entry and exit rules fixed when comparing combinations. A fifteen-minute context chart and a one-minute execution chart also overlap. Use only information available at the time, including the state of unfinished higher-timeframe bars.
Model Scalping Costs and Risk
A fixed stop one or two pips beyond a level is not suitable for every market. Choose invalidation based on the setup, then account for tick size, spread, volatility, and realistic fills. Smaller stops can increase the chance of noise-triggered exits.
For a hypothetical share trade at $25 with a $24.80 stop, $100 risk budget, and $0.05 per-share cost allowance, size is floor($100 ÷ $0.25) = 400 shares. Planned risk is $100 and position value is $10,000; account capital and exposure still need checking. Losses can exceed the estimate. Apply the correct contract or point value for other instruments, following position-sizing principles.
Bar-based backtests may not reproduce queue position, latency, spread changes, or the true sequence when a target and stop are both touched within one bar. Scrutinize these assumptions before interpreting a small average profit per trade.
Build and Test the Rules with LuxAlgo Quant
- Define the calculation. Specify the indicator, lookback, anchor, and any custom settings. Verify each selected Library entry’s calculation rather than assuming every implementation is identical.
- Define the trade. Include the symbol, session, chart interval, entry timing, stop, target, time exit, and sizing rule.
- Review the generated code. Check sample values and trades against the written rules. Correct data or formula mismatches before evaluating performance.
- Set realistic properties. Configure commission, slippage, capital, and other relevant native strategy properties. Inspect individual trades and drawdown.
- Compare and validate. Test the base strategy with and without the indicator filter, and reserve later data not used to select parameters.
Native Volume Delta and CVD provide a related footprint-based view on supported symbols and fixed-duration intervals. Check data availability; they do not automatically validate OBV, MFI, CMF, or KVO signals. A requested strategy input must actually be available to the implementation.
Video: Review Volume-Indicator Calculations
This FXEmpire tutorial covers selected volume indicators, including OBV and CMF. It is an educational supplement rather than a demonstration that all five tools produce profitable scalping signals.
Read next